Fig. 8.
Download original image
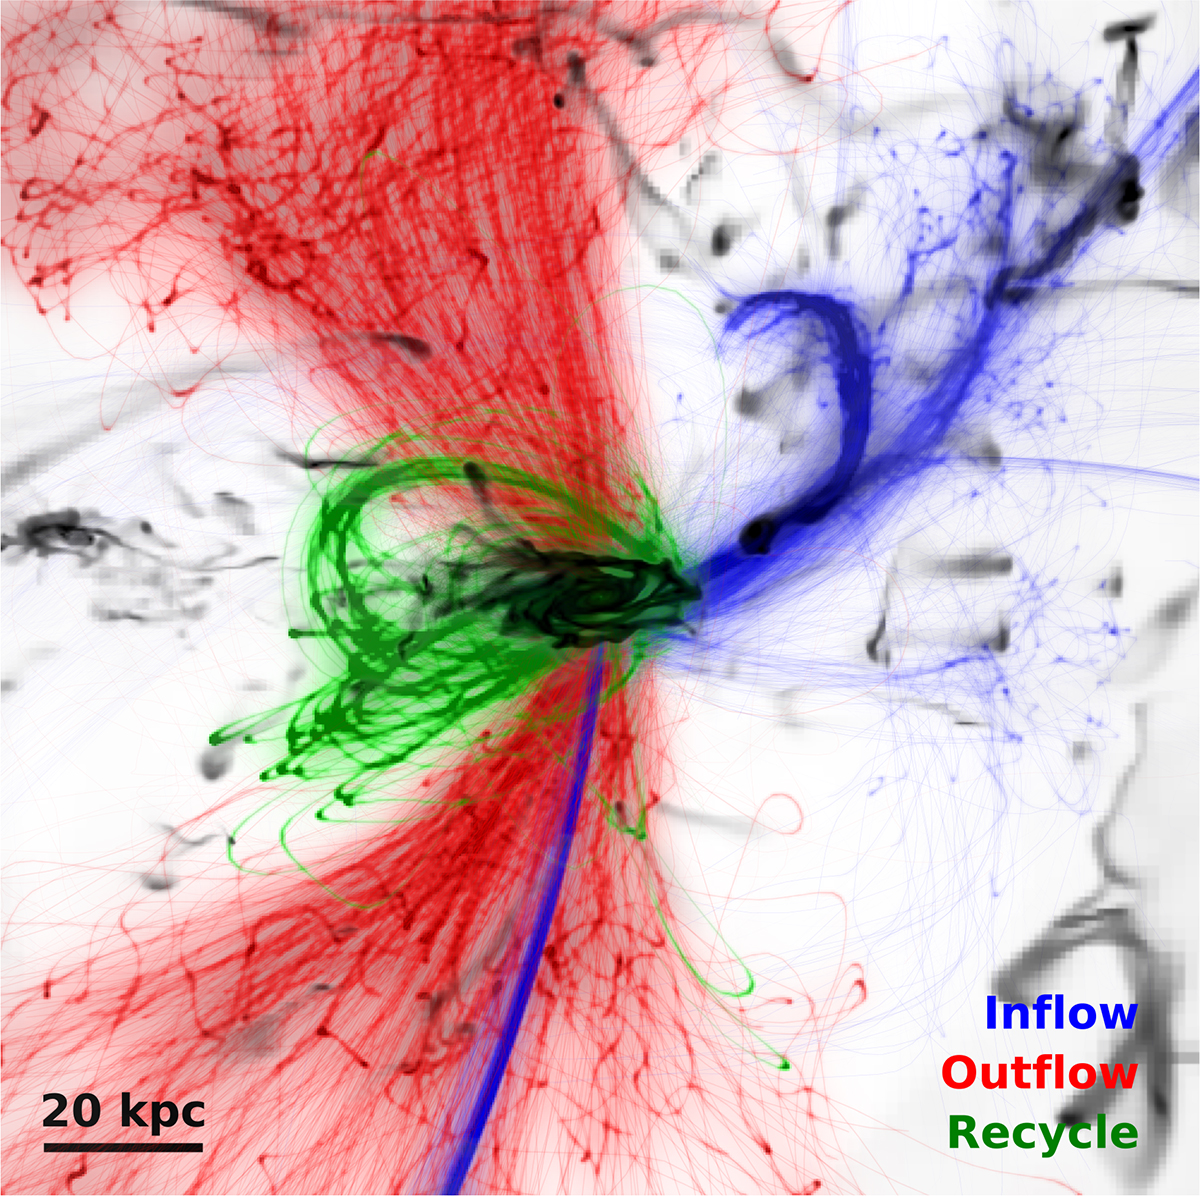
Smoothed trajectories of gas tracer particles that are located in the central region of the galaxy at z = 1.6. The greyscale background represents the gas temperature (i.e., cold gas in a darker color). Blue lines are the trajectory of the inflow gas 500 Myr before the central AGN activity. Red lines indicate outflow gas expelled by the violent jet. Green lines are similarly blown out but return back to the galactic disc.
Current usage metrics show cumulative count of Article Views (full-text article views including HTML views, PDF and ePub downloads, according to the available data) and Abstracts Views on Vision4Press platform.
Data correspond to usage on the plateform after 2015. The current usage metrics is available 48-96 hours after online publication and is updated daily on week days.
Initial download of the metrics may take a while.