Fig. 1.
Download original image
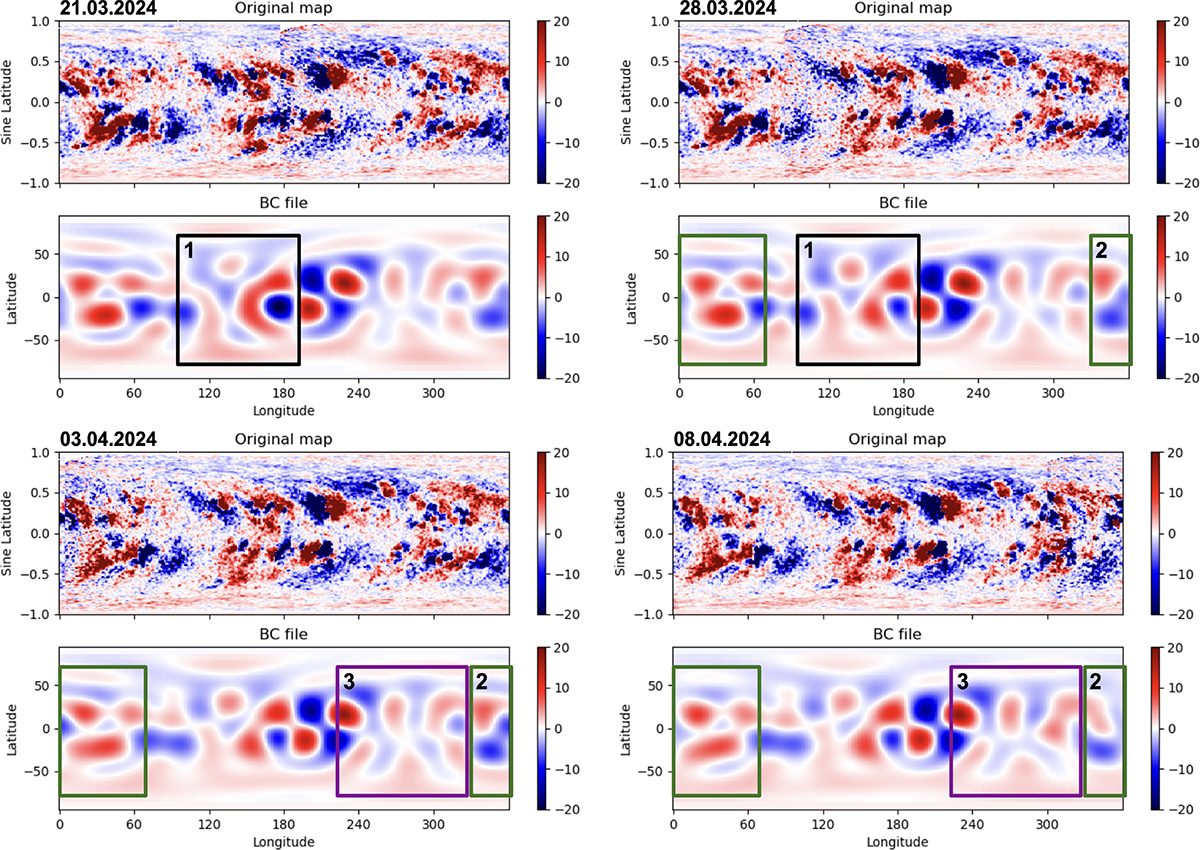
Original GONG (upper panels) and pre-processed input magnetograms (lower panels) for March 21, March 28, April 3 and April 8. The colour maps are saturated to the [−20, 20] G range. All maps are rotated so that they are aligned with the Earth’s view angle as of April 8, 2024. Squares 1, 2 and 3 represent the areas of interest.
Current usage metrics show cumulative count of Article Views (full-text article views including HTML views, PDF and ePub downloads, according to the available data) and Abstracts Views on Vision4Press platform.
Data correspond to usage on the plateform after 2015. The current usage metrics is available 48-96 hours after online publication and is updated daily on week days.
Initial download of the metrics may take a while.