Fig. 4.
Download original image
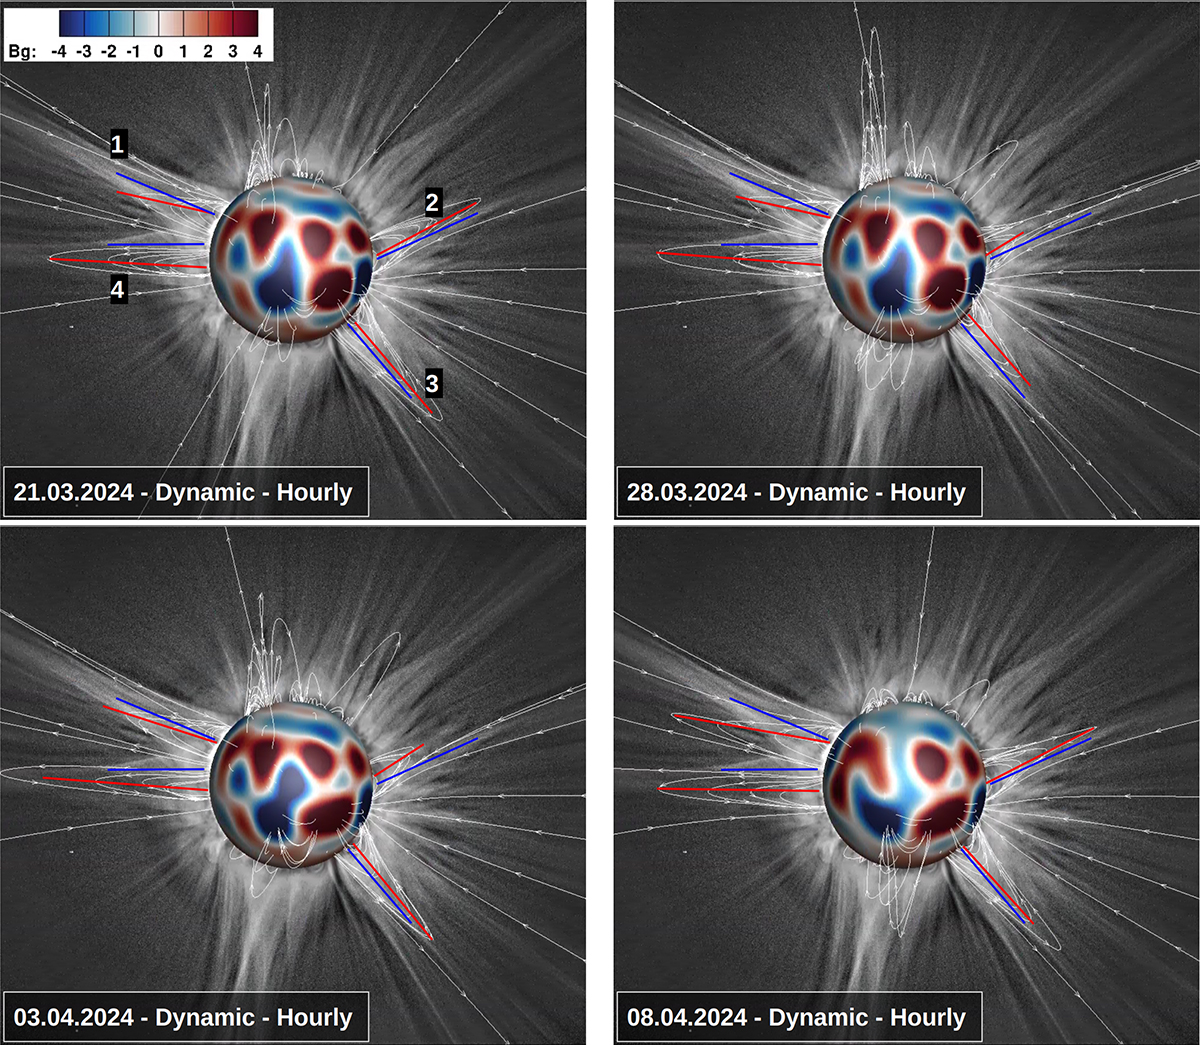
Predictions of the total solar eclipse by the COCONUT model in the dynamic regime with hourly updated magnetograms. Each figure corresponds to the corona prediction for different magnetogram files from Figure 1. The solar surface is coloured with the radial magnetic field values saturated to [−4,4]G. The magnetic field lines are overplotted on the eclipse image. The blue lines indicate the directions of the selected streamers based on the eclipse image. The red lines correspond to the direction of the same streamers as modelled by COCONUT simulations. Eclipse image credits: Eclipse team of Nanjing University – Wu, Sizhe (photographer); Li, Yihua; Huang, Yuhao; Lao, Qinghui; Cheng, Xin; Qu, Zhongquan.
Current usage metrics show cumulative count of Article Views (full-text article views including HTML views, PDF and ePub downloads, according to the available data) and Abstracts Views on Vision4Press platform.
Data correspond to usage on the plateform after 2015. The current usage metrics is available 48-96 hours after online publication and is updated daily on week days.
Initial download of the metrics may take a while.