Fig. 2
Download original image
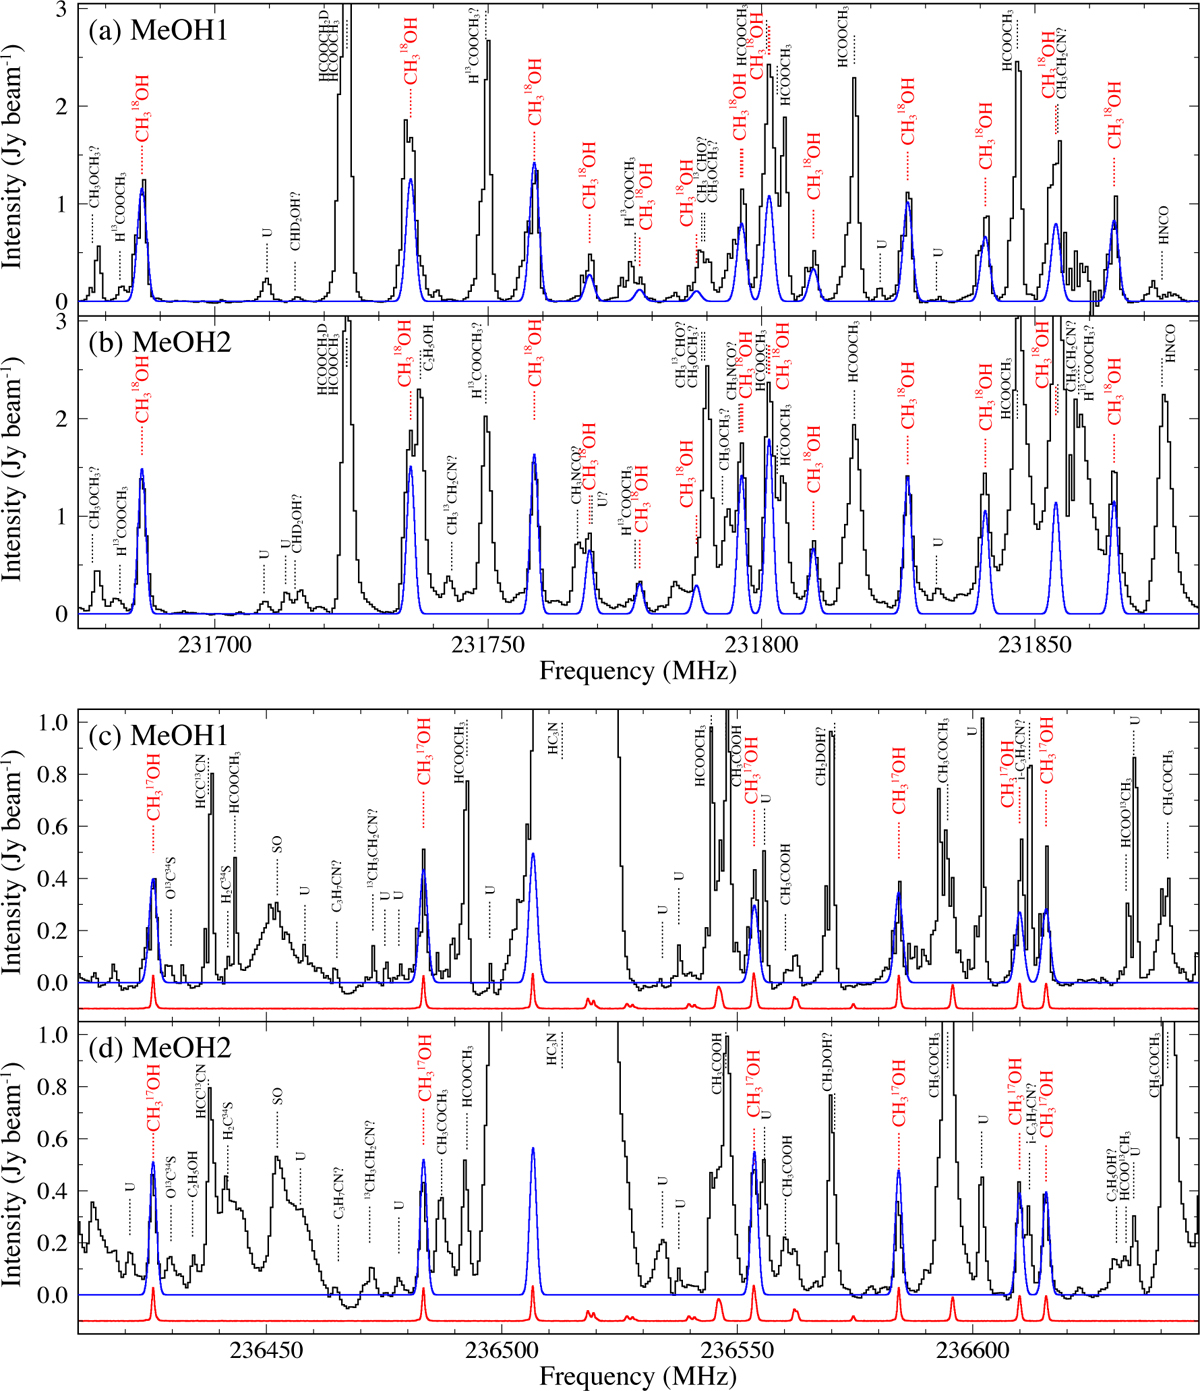
CH318OH spectra (black line) observed at the CH318OH peaks (a) MeOH1 and (b) MeOH2 in the rest frame, and CH317OH spectra (black line) observed at (c) MeOH1 and (d) MeOH2. The system velocities are assumed to be VLSR = 7.50 km s−1 and 7.55 km s−1 for MeOH1 and MeOH2, respectively. The spectra were obtained after the angular resolutions of observation data were convolved to be the 2″.0 × 2″.0 beam. The solid red line in (c) and (d) is the experimentally measured CH317OH spectrum obtained in a laboratory (Tamanai et al. 2025) with an arbitrary intensity scale. The dashed red lines are the positions of CH318OH and CH317OH and the dashed black lines are those of other molecules. Molecular names with a question mark, “?,” indicate the potential molecular species. “U” indicates an unidentified emission line. Blue lines are model spectra of CH318OH and CH317OH predicted with the LTE model by using the column densities estimated in Table 3 and the line parameters listed in Table 2. The line width is assumed to be 2.5 km s−1 and 2.1 km s−1 for MeOH1 and MeOH2, respectively; these values were evaluated from the Gaussian fitting to the CH318OH (50–40, E) line. The Sμ2 and Eu values are taken from Tamanai et al. (2025).
Current usage metrics show cumulative count of Article Views (full-text article views including HTML views, PDF and ePub downloads, according to the available data) and Abstracts Views on Vision4Press platform.
Data correspond to usage on the plateform after 2015. The current usage metrics is available 48-96 hours after online publication and is updated daily on week days.
Initial download of the metrics may take a while.