| Issue |
A&A
Volume 705, January 2026
|
|
|---|---|---|
| Article Number | A132 | |
| Number of page(s) | 8 | |
| Section | Interstellar and circumstellar matter | |
| DOI | https://doi.org/10.1051/0004-6361/202556325 | |
| Published online | 16 January 2026 | |
Observation of CH317OH and CH318OH in Orion KL: A new tool to study star formation history
1
College of Engineering, Shibaura Institute of Technology,
3-7-5 Toyosu, Koto-ku,
Tokyo
135-8548,
Japan
2
RIKEN Pioneering Research Institute,
2-1, Hirosawa, Wako,
Saitama
351-0198,
Japan
3
Max Planck Institute for Astronomy (MPIA),
Königstuhl 17,
69117
Heidelberg,
Germany
★ Corresponding author: This email address is being protected from spambots. You need JavaScript enabled to view it.
Received:
9
July
2025
Accepted:
9
October
2025
Abstract
Aims. Methanol is a seed species of complex organic molecules that is of fundamental importance in astrochemistry. Although various isotopologues of CH3OH have been detected in the interstellar medium (ISM), CH317OH is only tentatively detected in Sgr B2. To confirm the presence of CH317OH in the ISM and to investigate its abundance, we searched for its emission lines in the Orion KL region.
Methods. We obtained image cubes covering the frequency ranges 236.40–236.65 GHz and 231.68–231.88 GHz with a resolution of ~2 arcsec using ALMA archival data observed toward the Orion KL region. The spectra detected at the two CH318OH peaks, MeOH1 and MeOH2, were compared to the spectrum and frequencies of CH317OH measured in the laboratory. The column densities of CH317OH and CH318OH were estimated under the assumption of local thermodynamic equilibrium conditions with fixed excitation temperatures.
Results. We have identified six emission lines of CH317OH in MeOH1 and MeOH2 and confirmed that the line profiles and spatial distributions are consistent with those of CH318OH. The abundance ratios of CH318OH/CH317OH are evaluated to be ~3.4–3.5 and are similar to the canonical value of 18O/17O ~3–4 derived from CO observations in the Orion KL region. We have compared the results with the previous study of CH3OH and evaluated CH316OH/CH317OH ratios to be ~2300–2500 at a resolution of ~4 arcsec. The ratios are close to the 16O/17O ratio in the local ISM.
Conclusions. This result indicates that the CH3OH isotopologues can serve as new tracers of oxygen isotope ratios in star-forming regions because the opacity of CH3OH can be evaluated using transition lines spanning a wide range of line intensities. Moreover, this method enables us to study the star formation history of our Galaxy with the aid of the Galactic chemical evolution models.
Key words: astrochemistry / line: identification / stars: formation / ISM: abundances / ISM: molecules
© The Authors 2026
 Open Access article, published by EDP Sciences, under the terms of the Creative Commons Attribution License (https://creativecommons.org/licenses/by/4.0), which permits unrestricted use, distribution, and reproduction in any medium, provided the original work is properly cited.
This article is published in open access under the Subscribe to Open model. This email address is being protected from spambots. You need JavaScript enabled to view it. to support open access publication.
1 Introduction
Methanol (CH3OH) is one of the most fundamental saturated organic molecules in the interstellar medium (ISM) and a seed species of complex organic molecules. A laboratory experiment has demonstrated that this molecule is efficiently produced by the successive hydrogenation of CO on the surface of icy dust grains, as is supported by theoretical and experimental studies (e.g., Tielens & Whittet 1997; Watanabe & Kouchi 2002). In cold molecular clouds, the CH3OH formed is thought to be released into the gas phase through nonthermal sublimation driven by energy, such as surplus energy in chemical reactions, although the efficiency is not very high (e.g., Garrod et al. 2007; Soma et al. 2015). On the other hand, the CH3OH in the inner envelope of protostellar core appears in the gas phase through desorption by protostellar heating. Such regions are called hot cores in massive star-forming regions, or hot corinos in low-mass star-forming regions (e.g. Blake et al. 1987; van Dishoeck et al. 1995; Ceccarelli et al. 2007; Yang et al. 2021). CH3OH has also been observed toward various objects including shocked regions induced by outflows from protostars (e.g. Bachiller & Pérez Gutiérrez 1997), and external galaxies (e.g., Henkel et al. 1987; Watanabe et al. 2014).
The 18O isotopologue of CH3OH has been observed in various objects (e.g. Gardner et al. 1989; van Gelder et al. 2022), while the observation of the 17O isotopologue has only been reported in a single case (Müller et al. 2024). The primary reason for this was the lack of available laboratory spectroscopic data until recently. However, experimental spectroscopic measurements of CH317OH have now been carried out and reported by Müller et al. (2024) and Tamanai et al. (2025). Müller et al. (2024) have presented the rotational line list of CH317OH and the tentative detection of it in Sgr B2(N2b). Tamanai et al. (2025) also conducted spectroscopic measurements from 216 GHz to 264 GHz by an emission-type millimeter and submillimeter spectrometer (Watanabe et al. 2021) and reported line parameters of CH317OH based on the spectroscopic data and previous study (Hoshino et al. 1996). Moreover, they assigned several transition lines of ![Mathematical equation: $\[{ }^{13} \mathrm{CH}_3^{17} \mathrm{OH}\]$](/articles/aa/full_html/2026/01/aa56325-25/aa56325-25-eq1.png) , which were contained in the CH317OH sample as the natural abundance of 13C. The study of CH317OH in star-forming regions is still in its infancy, and the abundance ratios between CH317OH and other CH3OH isotopologues containing different oxygen isotopes are poorly understood. In contrast, deuterated CH3OH isotopologues are known to be enhanced by 2–3 orders of magnitude compared with the cosmic H/D ratio of ~10−5 (e.g. Mauersberger et al. 1988; Peng et al. 2012), due to grain-surface and gas-phase chemical reactions (e.g. Charnley et al. 1997). Meanwhile, the abundance of 13CH3OH is known to be similar to the elemental abundance ratio of 12C/13C (Soma et al. 2015). This is because CH3OH molecules are mainly formed from CO molecules, which account for the majority of the carbon budget in the molecular clouds. In this study, we search for the CH317OH emission lines in the Orion KL region by using the ALMA archive data and evaluate the isotope ratios of 18O/17O, 16O/17O, and 16O/18O in CH3OH.
, which were contained in the CH317OH sample as the natural abundance of 13C. The study of CH317OH in star-forming regions is still in its infancy, and the abundance ratios between CH317OH and other CH3OH isotopologues containing different oxygen isotopes are poorly understood. In contrast, deuterated CH3OH isotopologues are known to be enhanced by 2–3 orders of magnitude compared with the cosmic H/D ratio of ~10−5 (e.g. Mauersberger et al. 1988; Peng et al. 2012), due to grain-surface and gas-phase chemical reactions (e.g. Charnley et al. 1997). Meanwhile, the abundance of 13CH3OH is known to be similar to the elemental abundance ratio of 12C/13C (Soma et al. 2015). This is because CH3OH molecules are mainly formed from CO molecules, which account for the majority of the carbon budget in the molecular clouds. In this study, we search for the CH317OH emission lines in the Orion KL region by using the ALMA archive data and evaluate the isotope ratios of 18O/17O, 16O/17O, and 16O/18O in CH3OH.
Orion KL is a nearby massive star-forming region at a distance of ~420 pc (e.g., Hirota et al. 2007; Menten et al. 2007). In this region, oxygen-bearing molecular species such as CH3OH and HCOOCH3 are preferentially distributed in the vicinity of the compact ridge, while nitrogen-bearing molecular species such as CH3CN and CH3CH2CN are associated with the hot core (e.g., Wright et al. 1996; Beuther et al. 2005; Tercero et al. 2018). Favre et al. (2011) identified 28 methyl formate emission peaks and found that the strongest peaks, MF1 and MF2, are in the compact ridge. Peng et al. (2012) also identified the strongest CH2DOH emission peaks dM-1 and dM-3 in the almost identical positions as MF2 and MF1, respectively. As previous studies have demonstrated that CH3OH shows a high column density, and thus a high abundance in the compact ridge, we investigated the presence of CH317OH lines in this region by using Atacama Large Millimeter/submillimeter Array (ALMA).
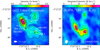 |
Fig. 1 (a) 1.3 mm continuum image of Orion KL observed with ALMA (#2013.1.00553.S). Contour levels are from 50 mJy−1 beam (5σ) to 950 mJy beam−1 with a 100 mJy beam−1 step. (b) Integrated intensity image of CH318OH (50–40 E) obtained by the ALMA SV. The contour levels are from 4.8 K km s−1 (3σ) to 28.8 K km s−1 with a 4.8 K km s−1 step. The white ellipses in the bottom left corner indicate the synthesized beams. The CH318OH peaks (MeOH1 and MeOH2) are shown by the white squares. The positions of Hot Core (HC), IRc7, and the HCOOCH3 peaks (MF) identified by Favre et al. (2011) are shown by the star, circle, and gray cross marks, respectively. The black cross marks show the positions of dM-1 and dM-3. |
2 Data and reductions
We utilized two ALMA archival data ADS/JAO.ALMA #2013.1.00553.S (PI: P. Goldsmith) and ADS/JAO.ALMA #2011.0.00009.SV (the ALMA Science Verification data of Orion KL) to search for CH317OH and CH318OH, respectively. The observation of ADS/JAO.ALMA #2013.1.00553.S was conducted on 29 December 2014 toward the Orion KL region where the phase center was (RA(J2000), Dec(J2000)) = (05h35m14s.160, −05°22′08″.504). The details regarding the observation are described in Pagani et al. (2017). We used one spectral window that covered the frequency range from 236.26 GHz to 237.20 GHz with a frequency resolution of 488 kHz. The calibrated visibility data were acquired by applying the data reduction script provided by the ALMA observatory with the Common Astronomy Software Application (CASA) package (CASA Team 2022) version 4.2.2, which contained the pipeline for the Cycle 2 ALMA observation. The visibility was imaged by using the CLEAN algorithm using Briggs weighting with a robustness parameter of 0.5, after the continuum emission was subtracted from the visibility data by fitting a 0-order polynomial to the line free channels using the task uvcontsub. The sensitivity and the synthesized beam of the cube data are 7 mJy beam−1 and 1″.7 × 1″.0 with the position angle (PA) of 87.6°, respectively. The continuum image was made by the continuum visibility data generated by the task uvcontsub. Figure 1a shows the continuum image in the 1.3 mm band (236.7 GHz). The image reproduces the structures reported by Pagani et al. (2017), which used the same observation data.
The observation of ADS/JAO.ALMA #2011.0.00009.SV was carried out on 20 January 2012 at the phase center of (RA(J2000), Dec(J2000)) = (05h35m14s.350, −05°22′36″.350) as a part of the ALMA Science Verification to demonstrate the capabilities of spectral line survey observation with ALMA. The observation covered the frequency range from 214 GHz to 247 GHz with a frequency resolution of 488 kHz. Among the frequency range, we obtained a synthesized images from 231.68 GHz to 231.88 GHz, which contained 16 transitions of the R-branch series of CH318OH with J = 5–4. The calibrated visibility data were imaged by using the CLEAN algorithm, Briggs weighting, and a robustness parameter of 0.5 after the continuum emission was subtracted from the visibility data by fitting a 0-order polynomial to the line free channels. The sensitivity and the synthesized beam of cube data are 12 mJy beam−1 and 1″.9 × 1″.4 with PA = −12.8°, respectively.
All the cube data and continuum images were corrected for the primary beam attenuation by applying task impbcor. CASA version 5.6.3 was used for all data processing after the calibration process.
Positions of MeOH1 and MeOH2.
3 Results
3.1 Detections of CH318OH and CH317OH
In the frequency range from 231.68 GHz to 231.88 GHz (Figures 2a and b), we detected the emission lines of CH318OH (50–40 E) with a signal-to-noise ratio of more than 100σ. Figure 1b is the integrated intensity map of CH318OH (50–40 E), which was made by integrating the velocity range from 4.5 km s−1 to 11.5 km s−1. We found two prominent CH318OH peaks, MeOH1 and MeOH2 (Table 1), which coincide with the methyl formate peaks, MF1 and MF2 (Favre et al. 2011), respectively, within the synthesized beam of 1″.9 × 1″.4. In addition to the CH318OH (50–40 E), 12 emission lines of CH318OH are detected at the MeOH1 and MeOH2 in the frequency range, but most of them are contaminated by other molecules, except for CH318OH (50–40 A+) and CH318OH (51–41 E) (Figures 2a and b).
We identified CH317OH emission lines in the spectra from 236.26 GHz to 237.20 GHz at the two peaks (Figures 2c and d). The red spectrum shows the CH317OH spectrum obtained from spectroscopic measurements in our laboratory (Tamanai et al. 2025), for comparison with the observed spectra (black line). In MeOH1 and MeOH2, six emission lines are identified as CH317OH with a S/N of more than 50σ. Most of the detected spectral lines are E symmetry transitions, whereas a A symmetry transition of 52–42 A− is found to be blended with the 53–43 E line at 236.554 GHz. In addition to the CH317OH lines, we assigned the other molecular lines in the spectra with the aid of spectral line databases, the Cologne Database for Molecular Spectroscopy (CDMS: Müller et al. 2001) and the Submillimeter, Millimeter, and Microwave Spectral Line Catalog provided by Jet Propulsion Laboratory (Pickett et al. 1998). Figure 3 shows the line profiles of CH317OH and CH318OH. Here, the cube data were convolved with Gaussian kernels to compare the spectra at the same angular resolution of 2″.0 × 2″.0. The peak velocities and line profiles of CH317OH lines are similar to those of CH318OH lines, although some of the CH317OH lines are contaminated by other nearby molecular emission lines. The line profile shows two velocity components centered at ~7.5 km s−1 and ~9 km s−1 in MeOH1. The same velocity components have been detected by the observation of methyl formate in MF1 (Favre et al. 2011). The integrated intensity maps of CH317OH and CH318OH lines are shown in Figure 4. The maps were obtained by integrating the velocity range from 4.5 km s−1 to 11.5 km s−1. Most of the CH317OH images show peak emission at the two CH318OH peaks, MeOH1 and MeOH2, while some images (e.g., Figures 4c and e) show the strongest peaks at other positions due to contamination by other molecular emission lines.
Line parameters of identified CH318OH and CH317OH.
3.2 Column densities
The column densities of CH317OH and CH318OH were calculated in MeOH1 and MeOH2 under the assumption of the local thermodynamic equilibrium (LTE) approximation with optically thin conditions (Table 3). Since we are observing transition lines with the critical density of ncrit ~ 105 cm−3 1, the assumption of LTE is justified because the emissions originate from sufficiently dense regions with the H2 volume density of nH2 > 108 cm−3 (Favre et al. 2011). We used the integrated intensities of CH318OH (50–40 E) and CH317OH (50–40 E) obtained from the convolved data cubes which have the common angular resolutions of 2″.0 × 2″.0. Using the CDMS and JPL databases, we have confirmed that these emission line are less contaminated by emission lines of other interstellar molecules. Assuming the canonical values of 16O/18O = 560 and 16O/17O = 2000 (Wilson 1999) and using the column densities and rotational temperatures of CH3OH at dM-1 and dM-3 from Peng et al. (2012), the optical depths of CH318OH (50–40 E) and CH317OH (50–40 E) are expected to be 0.05–0.12 and 0.01–0.04, respectively. Therefore, the assumption of the optically thin condition is considered reasonable. In the calculation, we assumed the rotation temperature of 58 K and 130 K for MeOH1 and MeOH2, respectively, which are the rotation temperatures of CH3OH in dM-3 and dM-1 (Peng et al. 2012). Since we evaluated the column densities from the single transitions with the fixed rotation temperatures, the column densities are subject to uncertainties due to these factors.
By using the assumed rotation temperatures and the derived column densities of CH317OH and CH318OH, we generated model spectra under the LTE approximation and overlaid them on the observed spectra at MeOH1 and MeOH2 (blue spectra in Figure 2). Here, we utilized the line parameters of CH317OH by Tamanai et al. (2025) and those in CDMS for CH318OH (Table 2). The model spectra show good agreement with the observed spectra at the positions of CH317OH and CH318OH, except for the lines contaminated by emission lines from other molecules. For the CH318OH, we also calculated the column densities using the integrated intensities of less contaminated CH318OH (51–41 E) line in order to confirm the values. These are consistent, within the uncertainties, with the values obtained from CH318OH (50–40 E). In this analysis, we attempted to estimate the column density and rotation temperature by using the rotation diagram method; however, the limited range of the upper state energies (Eu = 40–60 K) results in significant uncertainties in the derived values. Therefore, we employed the rotation temperatures of CH3OH from Peng et al. (2012).
The CH318OH/CH317OH ratios are evaluated to be 3.3 ± 0.2 in both MeOH1 and MeOH2, respectively. The assumed rotation temperatures have little effect on the CH318OH/CH317OH ratios because the upper state energies are very similar for the two transition lines due to the same quantum numbers.
In addition to the column densities in MeOH1 and MeOH2, the column densities of the two CH3OH isotopologues were calculated in the two CH2DOH peaks, dM-1 and dM-3, because Peng et al. (2012) estimated the column densities of CH3OH main isotopologue by using the observation in the 101 GHz band with IRAM PdBI. In spite of the high column density of CH3OH in the regions, the optical depths of the CH3OH lines have been confirmed to be less than 0.2 (Peng et al. 2012) due to the relatively small Sμ2 values of these transition lines. The positions of dM-1 and dM-3 almost coincide with those of MeOH2 and MeOH1, respectively, within the beam size of the PdBI observation (Figure 1). We used the same procedures to calculate the column densities of the two CH3OH isotopologues, after smoothing the angular resolution of the ALMA data to be 3″.8 × 2″.0 with a PA of 22°, which is the observation beam of Peng et al. (2012). The rotation temperatures of 130 K and 58 K were adopted for dM-1 and dM-3, respectively, following Peng et al. (2012). The column densities of three isotopologues are summarized in Table 3. The evaluated CH316OH/CH317OH, CH316OH/CH318OH, and CH318OH/CH317OH ratios are 2300 ± 300, 650 ± 70, and 3.5 ± 0.3, respectively in dM-1.
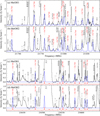 |
Fig. 2 CH318OH spectra (black line) observed at the CH318OH peaks (a) MeOH1 and (b) MeOH2 in the rest frame, and CH317OH spectra (black line) observed at (c) MeOH1 and (d) MeOH2. The system velocities are assumed to be VLSR = 7.50 km s−1 and 7.55 km s−1 for MeOH1 and MeOH2, respectively. The spectra were obtained after the angular resolutions of observation data were convolved to be the 2″.0 × 2″.0 beam. The solid red line in (c) and (d) is the experimentally measured CH317OH spectrum obtained in a laboratory (Tamanai et al. 2025) with an arbitrary intensity scale. The dashed red lines are the positions of CH318OH and CH317OH and the dashed black lines are those of other molecules. Molecular names with a question mark, “?,” indicate the potential molecular species. “U” indicates an unidentified emission line. Blue lines are model spectra of CH318OH and CH317OH predicted with the LTE model by using the column densities estimated in Table 3 and the line parameters listed in Table 2. The line width is assumed to be 2.5 km s−1 and 2.1 km s−1 for MeOH1 and MeOH2, respectively; these values were evaluated from the Gaussian fitting to the CH318OH (50–40, E) line. The Sμ2 and Eu values are taken from Tamanai et al. (2025). |
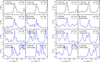 |
Fig. 3 Line profiles of CH318OH and CH317OH (Table 1) at the two methanol peaks, MeOH1 (left: a–h) and MeOH2 (right: i–o). The spectra were obtained after the angular resolutions of observation data were convolved to be the 2″.0 × 2″.0 beam for fair comparisons. The vertical scale is the brightness temperature. The vertical dashed lines indicate the system velocities of VLSR = 7.50 km s−1 and 7.55 km s−1 for MeOH1 and MeOH2, respectively. |
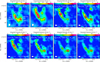 |
Fig. 4 Integrated intensity maps of (a) CH318OH (50–40 E), (b) CH318OH (51–41 E), (c) CH317OH (50 −40 E), (d) CH317OH (5−1–4−1 E), (e) CH317OH (53–43 E), (f) CH317OH (51–41 E), (g) CH317 OH (5−2–4−2 E), and (h) CH317OH (52–42 E). The contour levels are (a) from 4.8 K km s−1 (3σ) to 19.2 K km s−1 with a 4.8 K km s−1 step, (b) from 4.8 K km s−1 (3σ) to 24.0 K km s−1 with a 4.8 K km s−1 step, (c) from 2.3 K km s−1 (3σ) to 11.3 K km s−1 with a 2.3 K km s−1 step, (d) from 2.3 K km s−1 (3σ) to 8.4 K km s−1 with a 1.5 K km s−1 step, (e) from 2.3 K km s−1 (3σ) to 21.3 K km s−1 with a 3.8 K km s−1 step, (f) from 4.8 K km s−1 (3σ) to 8.4 K km s−1 with a 1.5 K km s−1 step, (g) from 4.8 K km s−1 (3σ) to 18.2 K km s−1 with a 2.3 K km s−1 step, and (h) from 2.3 K km s−1 (3σ) to 13.6 K km s−1 with a 2.3 K km s−1 step. The white ellipses in the bottom left corner indicate the synthesized beams. The symbols shown in the maps are the same as those in Figure 1. |
Column densities.
4 Discussion
4.1 Comparisons of oxygen isotope ratios with those of other molecules
The isotopic ratios of 18O/17O in the interstellar matter were estimated from observations of CO isotopologues (e.g., Penzias 1981). Persson et al. (2007) evaluated the 18O/17O ratio of 3.6 ± 0.7 by using C18O (J = 5–4) and C17O (J = 5–4) observed with Odin satellite toward Orion KL. Plume et al. (2012) derived the 18O/17O ratio of ![Mathematical equation: $\[4.1_{-1.3}^{+2.1}\]$](/articles/aa/full_html/2026/01/aa56325-25/aa56325-25-eq2.png) in the compact ridge, with which MeOH1 is associated, by using high-J lines of CO isotopologues observed with Herschel/HIFI, while they estimated different values of the ratios for the Hot Core (
in the compact ridge, with which MeOH1 is associated, by using high-J lines of CO isotopologues observed with Herschel/HIFI, while they estimated different values of the ratios for the Hot Core (![Mathematical equation: $\[3.0_{-1.1}^{+1.2}\]$](/articles/aa/full_html/2026/01/aa56325-25/aa56325-25-eq3.png) ), outflow and plateau (
), outflow and plateau (![Mathematical equation: $\[1.7_{-0.5}^{+0.4}\]$](/articles/aa/full_html/2026/01/aa56325-25/aa56325-25-eq4.png) ), and extended ridge (2.3 ± 0.5). Zou et al. (2023) estimated the 18O/17O ratio of 4.1 ± 0.1 in G209.00-19.38 in the Orion Nebula by using C18O (J = 2–1) and C17O (J = 2–1) lines observed with the SMT 10 m telescope. In addition, many transition lines of
), and extended ridge (2.3 ± 0.5). Zou et al. (2023) estimated the 18O/17O ratio of 4.1 ± 0.1 in G209.00-19.38 in the Orion Nebula by using C18O (J = 2–1) and C17O (J = 2–1) lines observed with the SMT 10 m telescope. In addition, many transition lines of ![Mathematical equation: $\[\mathrm{H}_2^{18} \mathrm{O}\]$](/articles/aa/full_html/2026/01/aa56325-25/aa56325-25-eq5.png) and H217O have been detected toward Orion KL with Herschel/HIFI (Melnick et al. 2010; Neill et al. 2013), but the 18O/17O ratio was not estimated from the water isotopologues because the detected H218O emission lines are moderately optically thick (Neill et al. 2013).
and H217O have been detected toward Orion KL with Herschel/HIFI (Melnick et al. 2010; Neill et al. 2013), but the 18O/17O ratio was not estimated from the water isotopologues because the detected H218O emission lines are moderately optically thick (Neill et al. 2013).
The 18O/17O ratios derived from CH3OH isotopologues are consistent with the ratios derived from high-J lines of CO isotopologues within the uncertainties. On the other hand, the ratio derived from the CO isotopologue lines with low J (Zou et al. 2023) is significantly higher than those from CH3OH isotopologues. The discrepancy cannot be explained by the optical depth of low-J transition lines of CO isotopologues. The 18O/17O ratio is likely to be underestimated, since the optical depth of C18O is usually higher than that of C17O by a factor of several. One possible explanation is that C17O is dissociated by the selective photodissociation by the interstellar UV radiation because C17O is optically thinner than C18O, as was discussed by Plume et al. (2012). As a result, the 18O/17O ratio derived from CO isotopologues would be higher than the canonical ratio. The transition lines of CO with low J especially tend to trace extended diffuse molecular gas that can be affected by the interstellar UV radiation. On the other hand, CH3OH is thought to reside in the deep inside of dense gas and to be less affected by UV radiation. The other potential explanation is that the CH318OH line is moderately optically thick.
The 16O/17O ratio of 2300 ± 300 and 16O/18O ratios of 650 ± 70 in dM-1 are consistent with the ratios of 16O/17O = 2000 ± 200 and 16O/18O = 560 ± 30 in the local ISM (Wilson 1999) within the uncertainty. In contrast, the 16O/18O ratios are significantly higher than the isotopic ratios of methyl formate reported by Tercero et al. (2012), who estimated the 16O/18O ratio to be ~218 from the total column density of the two isotopomer HC18OOCH3 and HCO18OCH3 observed with IRAM 30 m telescope toward Orion KL (Tercero et al. 2010). The 16O/18O ratio of CH3OH should be compared with the ratio of HCOOCH3/HC18OOCH3 or HCOOCH3/HCO18OCH3 because HCOOCH3 has two inequivalent oxygen atoms. The probability that each oxygen atom is substituted by 18O in HCOOCH3 is expected to scale with the 16O/18O ratio, provided that neither isotopic fractionation nor dilution occurs during chemical reactions. Therefore, the 16O/18O ratio in HCOOCH3 is evaluated to be twice as high as the ratio of Tercero et al. (2012). Even if a factor of two is considered, our ratios are still higher than that of HCOOCH3 by a factor of 1.5. One of the reasons for the underestimation is that the column density of the main HCOOCH3 isotopologue is underestimated due to the use of optically thick transitions. Another possibility is the effect of missing flux caused by the different antenna configurations between the observations or the subthermal excitation condition of CH3OH in this position, as was discussed in Peng et al. (2012). To confirm the difference, we need to observe multiple transition lines of CH3OH and CH318OH simultaneously with ALMA and apply an excitation analysis. This confirmation is for future work.
4.2 CH3OH as a tool of isotope ratio measurement
Although our analysis has uncertainty in the 16O/18O ratio, the isotope ratios derived from CH3OH isotopologue lines can potentially be more reliable than those from the low-J CO isotopologue lines because the CO isotopologues are sometimes affected by the optical thickness as well as the aforementioned selective photodissociation by the intense interstellar UV radiation. However, it should be noted that CH3OH is formed by hydrogenation of CO that has been frozen on interstellar dust grains in cold environments (e.g., Watanabe & Kouchi 2002; Soma et al. 2015). This implies that CH3OH may preserve the isotopic ratios of CO from the prestellar phase when the gas density is relatively low. While CH3OH is likely less affected by the selective photodissociation than the CO molecules that have remained exposed to interstellar UV radiation until the present day, the possible influence of this formation history on the derived isotope ratios warrants further investigation.
Specifically, future studies should examine the spatial distribution of CH317OH and CH318OH in hot cores or hot corinos with disk-like structures. By comparing the distributions from the outer regions where interstellar UV photons are more likely to penetrate to the inner regions where UV photons from the protostar are dominant, it may be possible to evaluate the effect of selective photodissociation on oxygen isotope ratios. Such studies, especially when discussed in connection with the known variation of 18O/16O and 17O/16O ratios in meteorites in the Solar System (e.g., Clayton 1993; Yurimoto & Kuramoto 2004), may provide valuable insights into the chemical origins of the Solar System.
The advantage of using CH3OH isotopologues lies more in the following point than those mentioned above: if an appropriate frequency setting is selected, multiple transition lines of CH3OH isotopologues can be simultaneously observed within a single ALMA frequency setup. As a result, precise isotope ratios are derived from the LTE modeling or the non-LTE modeling if the collision rates are available. Moreover, the column density of the main CH3OH isotopologue is derived if optically thin transition lines with a small line intensity, Sμ2, are carefully selected. As is described in Section 4.1, the optical depth of spectral lines is a critical factor in obtaining reliable isotopic ratio estimates, especially for the main isotopologue. In our analysis, we employed the J = 5–4 a-type transitions of CH317OH and CH318OH to derive the column density. However, the same transition lines of the main isotopologue could not be used due to high optical depth. Instead of these lines, we utilized the column densities of the main isotopologue, which were derived from optically thin lines with smaller Sμ2 values by Peng et al. (2012). Taking these into consideration, this method allows for a reliable estimation of oxygen isotopic ratios. The elemental abundances are usually measured by the observation of atomic lines toward HII regions. The abundances of isotopes, however, cannot be measured using the same method because the atomic lines of isotopes are contaminated by the main isotopic line due to the relatively broad line width (~10 km s−1) in the HII regions. The isotope ratios are generally determined by the observation of isotopologues.
These isotope ratios can be used to constrain the star formation history of the Galaxy with the Galactic chemical evolution (GCE) models. The elemental abundances reflect the star formation history in the Galaxy because the metal enrichment proceeds with nucleosynthesis in various types of stars. The negative abundance gradients for heavy elements along the Galactocentric distance have been known by the observations of atomic lines toward the Galactic HII regions (e.g., Shaver et al. 1983; Arellano-Córdova et al. 2020). The observed gradients of elemental abundances are thought to result from the inside-out star formation in the Galaxy (e.g., Larson 1976) and are explained by the GCE models (e.g., references in Romano 2022). Because different isotopes are synthesized by different processes, the isotopic ratios of stable isotopes provide unique parameters to constrain the GCE models. For instance, the 12C/13C ratio increases with the Galactocentric distance (Milam et al. 2005) because the primary element of 12C is produced faster than the secondary element of 13C. In the case of the oxygen isotopes, 18O is primarily produced in the massive star, while 17O is synthesized in the intermediate-mass stars on a longer timescale (e.g., Henkel & Mauersberger 1993). Martín et al. (2019) report that the 18O/17O ratio is enhanced in the central molecular zone of starburst galaxy NGC 253, suggesting the enrichment of 18O by the massive stars. With the observation of CO isotopologues, a positive gradient of the 18O/17O ratio has been reported (e.g. Wouterloot et al. 2008; Zhang et al. 2020; Zou et al. 2023) in the Galaxy. Nevertheless, the sample size is small and scarce on the outer disk (> 10 kpc from the Galactic center). Therefore, simultaneous survey observations of CH317OH, CH318OH, and CH316OH toward the hot cores in the outer disk regions with ALMA would increase the sample size of 18O/17O and 16O/18O ratios and contribute to improving the GCE models in our Galaxy.
5 Conclusions
In this paper, the identification of emission lines of CH317OH in the Orion KL region has been carried out by making use of our own experimentally measured spectra in the frequency range from 236.40 GHz to 236.65 GHz. We evaluated the abundance ratios of the CH3OH isotopologues, CH316OH, CH317OH, and CH318OH, through comparative verification. The results are summarized as follows:
We identified six emission lines of rare isotopologue CH317OH toward the two CH318OH emission peaks, MeOH1 and MeOH2, in Orion KL by using ALMA Archive data in the 1.3 mm band. Because the line profiles and spatial resolution of CH317OH are similar to those of CH318OH, these CH3OH isotopologues are expected to reside in the same regions.
The isotopologue ratios of CH318OH/CH317OH are derived to be ~3.4–3.5 with a resolution of 4.0 arcsec under the LTE approximation with fixed excitation temperatures. The ratios are consistent with the 18O/17O ratios estimated from high-excitation transition lines of CO isotopologues observed in the Orion KL region.
We also estimated the CH316OH/CH317OH ratio to be ~2300–2500 by using CH3OH column density reported by Peng et al. (2012) with a resolution of ~4.0 arcsec and found that the ratios are consistent with the canonical 16O/17O ratio in the local ISM.
The simultaneous observation of CH3OH isotopologues with ALMA would provide a unique method of estimating the isotope ratios of oxygen in the star-forming regions. Since transition lines of CH3OH have a wide range of line intensities, optically thin transition lines can be used even for the main isotopologue. The measurements of the oxygen isotope ratios will contribute to constraining the GCE models and delineating the star formation history of the Galaxy.
Acknowledgements
This paper makes use of the ALMA dataset ADS/JAO.ALMA#2013.1.00553.S and ADS/JAO.ALMA#2011.0.00009.SV. ALMA is a partnership of the ESO (representing its member states), the NSF (USA) and NINS (Japan), together with the NRC (Canada) and the NSC and ASIAA (Taiwan), in cooperation with the Republic of Chile. The Joint ALMA Observatory is operated by the ESO, the AUI/NRAO and the NAOJ. The authors are grateful to the ALMA staff for their excellent support. This study is supported by a Grant-in-Aid from the Ministry of Education, Culture, Sports, Science, and Technology of Japan (No.20H05845) and a pioneering project in RIKEN (Evolution of Matter in the Universe). Y.W. acknowledges support from a Grant-in-Aid from the Ministry of Education, Culture, Sports, Science, and Technology of Japan (Nos. 25K01042, 24K00675, 25H00676).
References
- Arellano-Córdova, K. Z., Esteban, C., García-Rojas, J., & Méndez-Delgado, J. E. 2020, MNRAS, 496, 1051 [Google Scholar]
- Bachiller, R., & Pérez Gutiérrez, M. 1997, ApJ, 487, L93 [Google Scholar]
- Beuther, H., Zhang, Q., Greenhill, L. J., et al. 2005, ApJ, 632, 355 [Google Scholar]
- Blake, G. A., Sutton, E. C., Masson, C. R., & Phillips, T. G. 1987, ApJ, 315, 621 [Google Scholar]
- CASA Team (Bean, B., et al.) 2022, PASP, 134, 114501 [NASA ADS] [CrossRef] [Google Scholar]
- Ceccarelli, C., Caselli, P., Herbst, E., Tielens, A. G. G. M., & Caux, E. 2007, in Protostars and Planets V, eds. B. Reipurth, D. Jewitt, & K. Keil, 47 [Google Scholar]
- Charnley, S. B., Tielens, A. G. G. M., & Rodgers, S. D. 1997, ApJ, 482, L203 [NASA ADS] [CrossRef] [Google Scholar]
- Clayton, R. N. 1993, Annu. Rev. Earth Planet. Sci., 21, 115 [Google Scholar]
- Favre, C., Despois, D., Brouillet, N., et al. 2011, A&A, 532, A32 [NASA ADS] [CrossRef] [EDP Sciences] [Google Scholar]
- Fisher, J., Paciga, G., Xu, L.-H., et al. 2007, J. Mol. Spectrosc., 245, 7 [NASA ADS] [CrossRef] [Google Scholar]
- Gardner, F. F., Whiteoak, J. B., Reynolds, J., Peters, W. L., & Kuiper, T. B. H. 1989, MNRAS, 240, 35 [Google Scholar]
- Garrod, R. T., Wakelam, V., & Herbst, E. 2007, A&A, 467, 1103 [NASA ADS] [CrossRef] [EDP Sciences] [Google Scholar]
- Gerry, M. C. L., Lees, R. M., & Winnewisser, G. 1976, J. Mol. Spectrosc., 61, 231 [NASA ADS] [CrossRef] [Google Scholar]
- Henkel, C., & Mauersberger, R. 1993, A&A, 274, 730 [NASA ADS] [Google Scholar]
- Henkel, C., Jacq, T., Mauersberger, R., Menten, K. M., & Steppe, H. 1987, A&A, 188, L1 [NASA ADS] [Google Scholar]
- Hirota, T., Bushimata, T., Choi, Y. K., et al. 2007, PASJ, 59, 897 [NASA ADS] [CrossRef] [Google Scholar]
- Hoshino, Y., Ohishi, M., Akabane, K., et al. 1996, ApJS, 104, 317 [NASA ADS] [CrossRef] [Google Scholar]
- Hughes, R. H., Good, W. E., & Coles, D. K. 1951, Phys. Rev., 84, 418 [NASA ADS] [CrossRef] [Google Scholar]
- Ikeda, M., Duan, Y.-B., Tsunekawa, S., & Takagi, K. 1998, ApJS, 117, 249 [NASA ADS] [CrossRef] [Google Scholar]
- Larson, R. B. 1976, MNRAS, 176, 31 [NASA ADS] [CrossRef] [Google Scholar]
- Martín, S., Muller, S., Henkel, C., et al. 2019, A&A, 624, A125 [NASA ADS] [CrossRef] [EDP Sciences] [Google Scholar]
- Mauersberger, R., Henkel, C., Jacq, T., & Walmsley, C. M. 1988, A&A, 194, L1 [NASA ADS] [Google Scholar]
- Melnick, G. J., Tolls, V., Neufeld, D. A., et al. 2010, A&A, 521, L27 [CrossRef] [EDP Sciences] [Google Scholar]
- Menten, K. M., Reid, M. J., Forbrich, J., & Brunthaler, A. 2007, A&A, 474, 515 [NASA ADS] [CrossRef] [EDP Sciences] [Google Scholar]
- Milam, S. N., Savage, C., Brewster, M. A., Ziurys, L. M., & Wyckoff, S. 2005, ApJ, 634, 1126 [Google Scholar]
- Müller, H. S. P., Thorwirth, S., Roth, D. A., & Winnewisser, G. 2001, A&A, 370, L49 [Google Scholar]
- Müller, H. S. P., Ilyushin, V. V., Belloche, A., Lewen, F., & Schlemmer, S. 2024, A&A, 688, A201 [NASA ADS] [CrossRef] [EDP Sciences] [Google Scholar]
- Neill, J. L., Wang, S., Bergin, E. A., et al. 2013, ApJ, 770, 142 [Google Scholar]
- Pagani, L., Favre, C., Goldsmith, P. F., et al. 2017, A&A, 604, A32 [NASA ADS] [CrossRef] [EDP Sciences] [Google Scholar]
- Peng, T. C., Despois, D., Brouillet, N., Parise, B., & Baudry, A. 2012, A&A, 543, A152 [NASA ADS] [CrossRef] [EDP Sciences] [Google Scholar]
- Penzias, A. A. 1981, ApJ, 249, 518 [Google Scholar]
- Persson, C. M., Olofsson, A. O. H., Koning, N., et al. 2007, A&A, 476, 807 [EDP Sciences] [Google Scholar]
- Pickett, H. M., Poynter, R. L., Cohen, E. A., et al. 1998, J. Quant. Spec. Radiat. Transf., 60, 883 [Google Scholar]
- Plume, R., Bergin, E. A., Phillips, T. G., et al. 2012, ApJ, 744, 28 [Google Scholar]
- Predoi-Cross, A., Lees, R. M., Lichau, H., Winnewisser, M., & Drummond, J. R. 1997, Int. J. Infrared Millimeter Waves, 18, 2047 [NASA ADS] [CrossRef] [Google Scholar]
- Romano, D. 2022, A&A Rev., 30, 7 [NASA ADS] [CrossRef] [Google Scholar]
- Schöier, F. L., van der Tak, F. F. S., van Dishoeck, E. F., & Black, J. H. 2005, A&A, 432, 369 [Google Scholar]
- Shaver, P. A., McGee, R. X., Newton, L. M., Danks, A. C., & Pottasch, S. R. 1983, MNRAS, 204, 53 [NASA ADS] [CrossRef] [Google Scholar]
- Soma, T., Sakai, N., Watanabe, Y., & Yamamoto, S. 2015, ApJ, 802, 74 [NASA ADS] [CrossRef] [Google Scholar]
- Tamanai, A., Oyama, T., Watanabe, Y., et al. 2025, ApJ, 980, 110 [Google Scholar]
- Tercero, B., Cernicharo, J., Pardo, J. R., & Goicoechea, J. R. 2010, A&A, 517, A96 [NASA ADS] [CrossRef] [EDP Sciences] [Google Scholar]
- Tercero, B., Margulès, L., Carvajal, M., et al. 2012, A&A, 538, A119 [NASA ADS] [CrossRef] [EDP Sciences] [Google Scholar]
- Tercero, B., Cuadrado, S., López, A., et al. 2018, A&A, 620, L6 [NASA ADS] [CrossRef] [EDP Sciences] [Google Scholar]
- Tielens, A. G. G. M. & Whittet, D. C. B. 1997, in IAU Symposium, 178, IAU Symposium, ed. E. F. van Dishoeck, 45 [Google Scholar]
- van Dishoeck, E. F., Blake, G. A., Jansen, D. J., & Groesbeck, T. D. 1995, ApJ, 447, 760 [Google Scholar]
- van Gelder, M. L., Jaspers, J., Nazari, P., et al. 2022, A&A, 667, A136 [NASA ADS] [CrossRef] [EDP Sciences] [Google Scholar]
- Watanabe, N., & Kouchi, A. 2002, ApJ, 571, L173 [Google Scholar]
- Watanabe, Y., Sakai, N., Sorai, K., & Yamamoto, S. 2014, ApJ, 788, 4 [NASA ADS] [CrossRef] [Google Scholar]
- Watanabe, Y., Chiba, Y., Sakai, T., et al. 2021, PASJ, 73, 372 [Google Scholar]
- Wilson, T. L. 1999, Rep. Progr. Phys., 62, 143 [CrossRef] [Google Scholar]
- Wouterloot, J. G. A., Henkel, C., Brand, J., & Davis, G. R. 2008, A&A, 487, 237 [NASA ADS] [CrossRef] [EDP Sciences] [Google Scholar]
- Wright, M. C. H., Plambeck, R. L., & Wilner, D. J. 1996, ApJ, 469, 216 [CrossRef] [Google Scholar]
- Yang, Y.-L., Sakai, N., Zhang, Y., et al. 2021, ApJ, 910, 20 [Google Scholar]
- Yurimoto, H., & Kuramoto, K. 2004, Science, 305, 1763 [Google Scholar]
- Zhang, J. S., Liu, W., Yan, Y. T., et al. 2020, ApJS, 249, 6 [Google Scholar]
- Zou, Y. P., Zhang, J. S., Henkel, C., et al. 2023, ApJS, 268, 56 [Google Scholar]
The ncrit value is estimated from Ai,i/Ci,j for CH3OH (50–40, E) at 100 K where Ai,j and Ci,j is the Einstein A and C coefficient, respectively, from Leiden Atomic and Molecular Database (Schöier et al. 2005).
All Tables
All Figures
|
Fig. 1 (a) 1.3 mm continuum image of Orion KL observed with ALMA (#2013.1.00553.S). Contour levels are from 50 mJy−1 beam (5σ) to 950 mJy beam−1 with a 100 mJy beam−1 step. (b) Integrated intensity image of CH318OH (50–40 E) obtained by the ALMA SV. The contour levels are from 4.8 K km s−1 (3σ) to 28.8 K km s−1 with a 4.8 K km s−1 step. The white ellipses in the bottom left corner indicate the synthesized beams. The CH318OH peaks (MeOH1 and MeOH2) are shown by the white squares. The positions of Hot Core (HC), IRc7, and the HCOOCH3 peaks (MF) identified by Favre et al. (2011) are shown by the star, circle, and gray cross marks, respectively. The black cross marks show the positions of dM-1 and dM-3. |
| In the text | |
|
Fig. 2 CH318OH spectra (black line) observed at the CH318OH peaks (a) MeOH1 and (b) MeOH2 in the rest frame, and CH317OH spectra (black line) observed at (c) MeOH1 and (d) MeOH2. The system velocities are assumed to be VLSR = 7.50 km s−1 and 7.55 km s−1 for MeOH1 and MeOH2, respectively. The spectra were obtained after the angular resolutions of observation data were convolved to be the 2″.0 × 2″.0 beam. The solid red line in (c) and (d) is the experimentally measured CH317OH spectrum obtained in a laboratory (Tamanai et al. 2025) with an arbitrary intensity scale. The dashed red lines are the positions of CH318OH and CH317OH and the dashed black lines are those of other molecules. Molecular names with a question mark, “?,” indicate the potential molecular species. “U” indicates an unidentified emission line. Blue lines are model spectra of CH318OH and CH317OH predicted with the LTE model by using the column densities estimated in Table 3 and the line parameters listed in Table 2. The line width is assumed to be 2.5 km s−1 and 2.1 km s−1 for MeOH1 and MeOH2, respectively; these values were evaluated from the Gaussian fitting to the CH318OH (50–40, E) line. The Sμ2 and Eu values are taken from Tamanai et al. (2025). |
| In the text | |
|
Fig. 3 Line profiles of CH318OH and CH317OH (Table 1) at the two methanol peaks, MeOH1 (left: a–h) and MeOH2 (right: i–o). The spectra were obtained after the angular resolutions of observation data were convolved to be the 2″.0 × 2″.0 beam for fair comparisons. The vertical scale is the brightness temperature. The vertical dashed lines indicate the system velocities of VLSR = 7.50 km s−1 and 7.55 km s−1 for MeOH1 and MeOH2, respectively. |
| In the text | |
|
Fig. 4 Integrated intensity maps of (a) CH318OH (50–40 E), (b) CH318OH (51–41 E), (c) CH317OH (50 −40 E), (d) CH317OH (5−1–4−1 E), (e) CH317OH (53–43 E), (f) CH317OH (51–41 E), (g) CH317 OH (5−2–4−2 E), and (h) CH317OH (52–42 E). The contour levels are (a) from 4.8 K km s−1 (3σ) to 19.2 K km s−1 with a 4.8 K km s−1 step, (b) from 4.8 K km s−1 (3σ) to 24.0 K km s−1 with a 4.8 K km s−1 step, (c) from 2.3 K km s−1 (3σ) to 11.3 K km s−1 with a 2.3 K km s−1 step, (d) from 2.3 K km s−1 (3σ) to 8.4 K km s−1 with a 1.5 K km s−1 step, (e) from 2.3 K km s−1 (3σ) to 21.3 K km s−1 with a 3.8 K km s−1 step, (f) from 4.8 K km s−1 (3σ) to 8.4 K km s−1 with a 1.5 K km s−1 step, (g) from 4.8 K km s−1 (3σ) to 18.2 K km s−1 with a 2.3 K km s−1 step, and (h) from 2.3 K km s−1 (3σ) to 13.6 K km s−1 with a 2.3 K km s−1 step. The white ellipses in the bottom left corner indicate the synthesized beams. The symbols shown in the maps are the same as those in Figure 1. |
| In the text | |
Current usage metrics show cumulative count of Article Views (full-text article views including HTML views, PDF and ePub downloads, according to the available data) and Abstracts Views on Vision4Press platform.
Data correspond to usage on the plateform after 2015. The current usage metrics is available 48-96 hours after online publication and is updated daily on week days.
Initial download of the metrics may take a while.