Fig. 3
Download original image
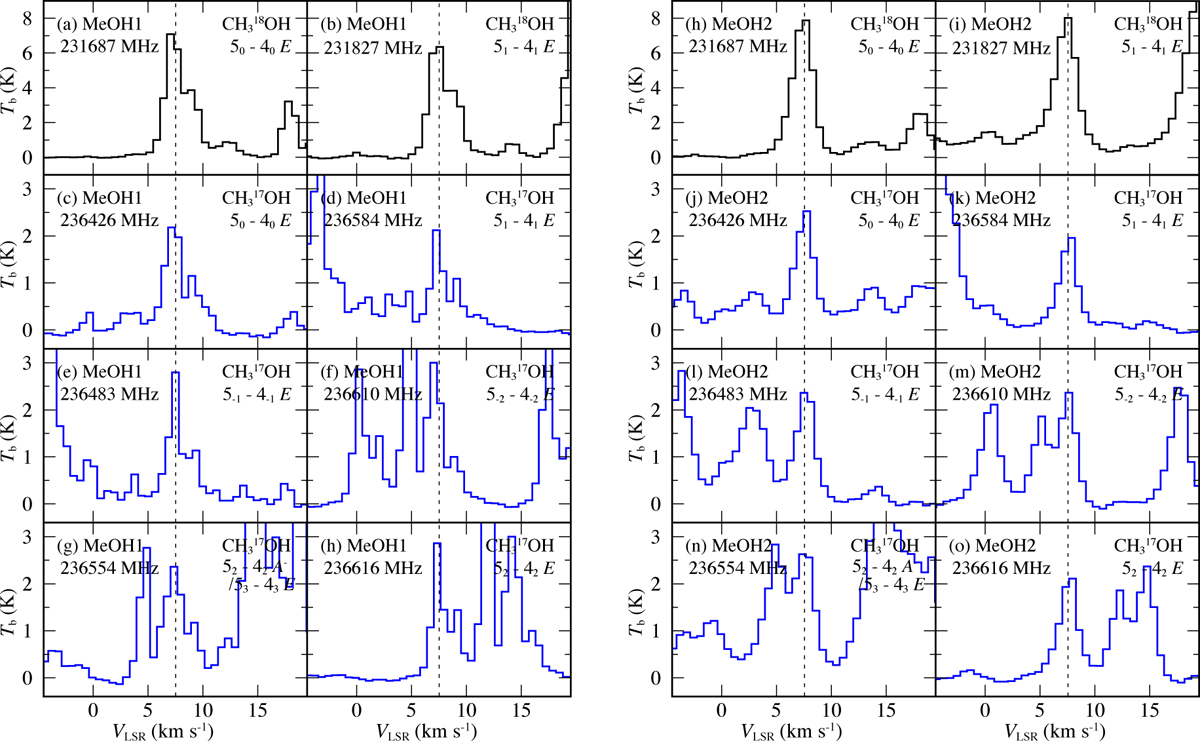
Line profiles of CH318OH and CH317OH (Table 1) at the two methanol peaks, MeOH1 (left: a–h) and MeOH2 (right: i–o). The spectra were obtained after the angular resolutions of observation data were convolved to be the 2″.0 × 2″.0 beam for fair comparisons. The vertical scale is the brightness temperature. The vertical dashed lines indicate the system velocities of VLSR = 7.50 km s−1 and 7.55 km s−1 for MeOH1 and MeOH2, respectively.
Current usage metrics show cumulative count of Article Views (full-text article views including HTML views, PDF and ePub downloads, according to the available data) and Abstracts Views on Vision4Press platform.
Data correspond to usage on the plateform after 2015. The current usage metrics is available 48-96 hours after online publication and is updated daily on week days.
Initial download of the metrics may take a while.