Fig. 4
Download original image
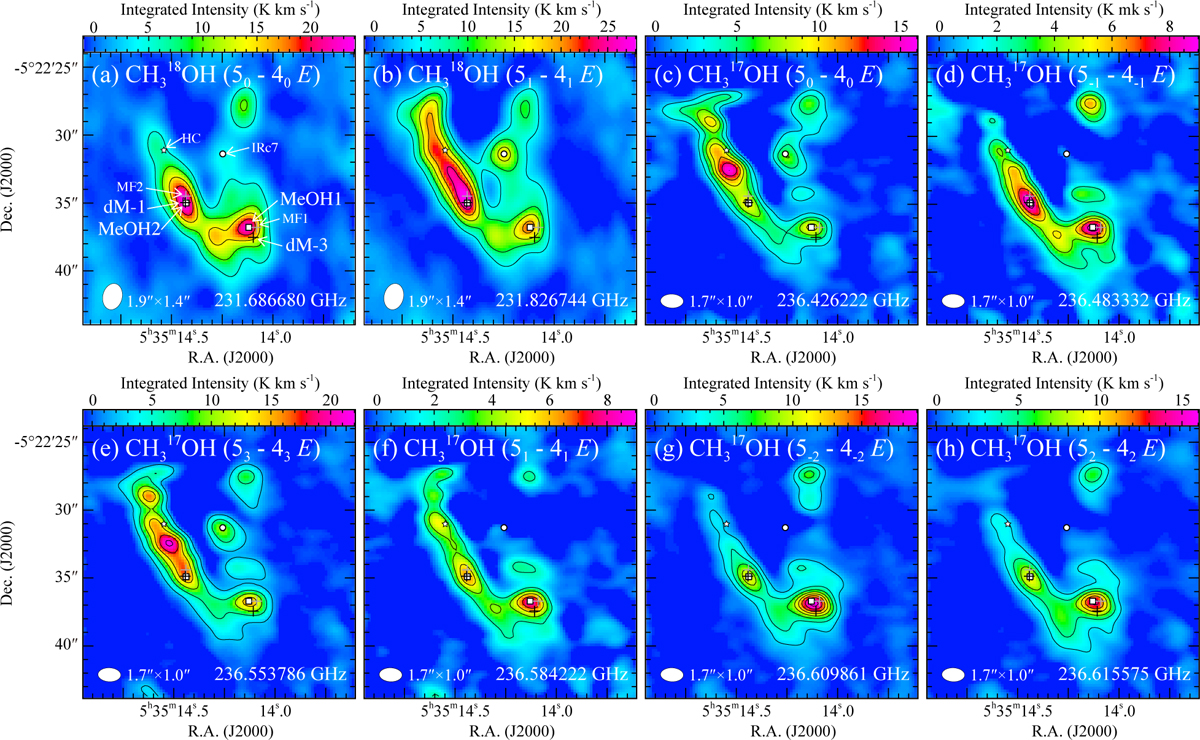
Integrated intensity maps of (a) CH318OH (50–40 E), (b) CH318OH (51–41 E), (c) CH317OH (50 −40 E), (d) CH317OH (5−1–4−1 E), (e) CH317OH (53–43 E), (f) CH317OH (51–41 E), (g) CH317 OH (5−2–4−2 E), and (h) CH317OH (52–42 E). The contour levels are (a) from 4.8 K km s−1 (3σ) to 19.2 K km s−1 with a 4.8 K km s−1 step, (b) from 4.8 K km s−1 (3σ) to 24.0 K km s−1 with a 4.8 K km s−1 step, (c) from 2.3 K km s−1 (3σ) to 11.3 K km s−1 with a 2.3 K km s−1 step, (d) from 2.3 K km s−1 (3σ) to 8.4 K km s−1 with a 1.5 K km s−1 step, (e) from 2.3 K km s−1 (3σ) to 21.3 K km s−1 with a 3.8 K km s−1 step, (f) from 4.8 K km s−1 (3σ) to 8.4 K km s−1 with a 1.5 K km s−1 step, (g) from 4.8 K km s−1 (3σ) to 18.2 K km s−1 with a 2.3 K km s−1 step, and (h) from 2.3 K km s−1 (3σ) to 13.6 K km s−1 with a 2.3 K km s−1 step. The white ellipses in the bottom left corner indicate the synthesized beams. The symbols shown in the maps are the same as those in Figure 1.
Current usage metrics show cumulative count of Article Views (full-text article views including HTML views, PDF and ePub downloads, according to the available data) and Abstracts Views on Vision4Press platform.
Data correspond to usage on the plateform after 2015. The current usage metrics is available 48-96 hours after online publication and is updated daily on week days.
Initial download of the metrics may take a while.