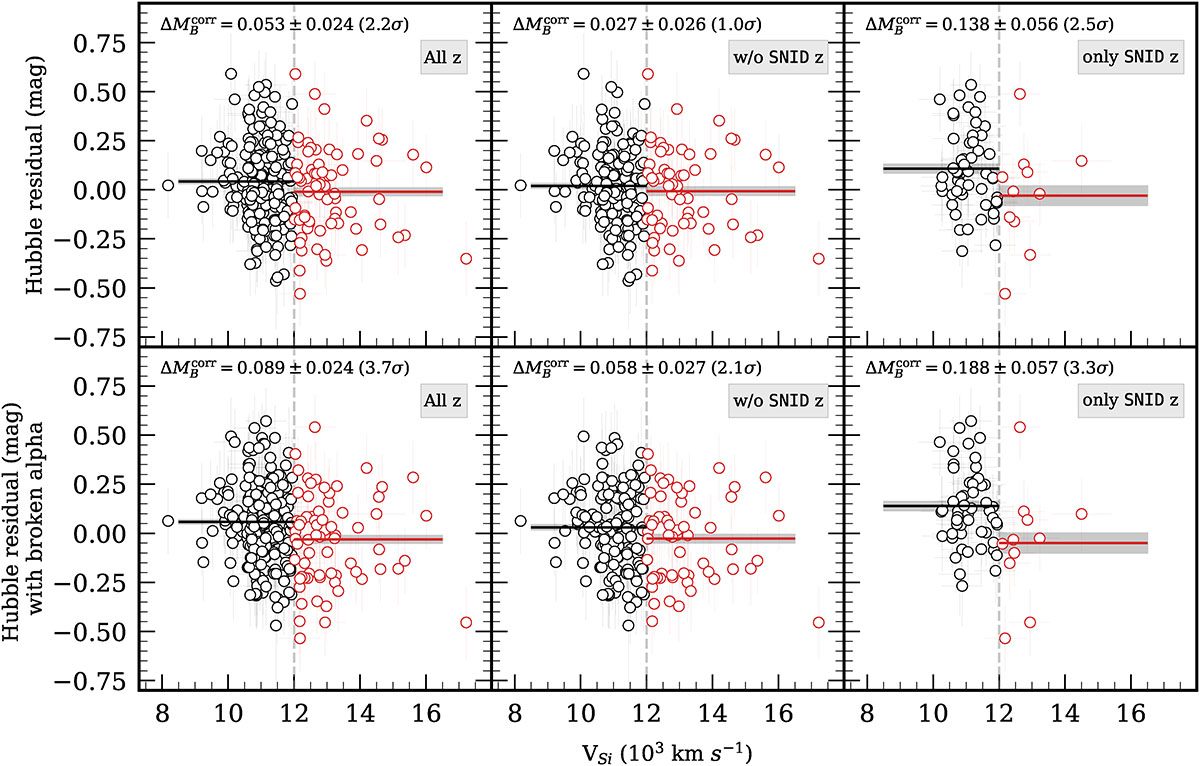
Fig. 1.
Download original image
Hubble residuals as a function of Si IIλ6355 velocity (vSi). Top Left: Hubble residuals for NV (black points) and HV (red points) including all redshift sources (see: Section 2.1 for the redshift sources). Top Middle: Same as on the left, but without the template-matched redshift sources. Top right: Same as on the left, but with the template-matched redshift sources alone. Bottom left: Hubble residuals with broken alpha from Ginolin et al. (2025b) for all redshift sources included in the sample. Bottom middle: Same as on the bottom left, but without the template-matched redshift sources. Bottom right: Same as on the bottom left, but with the template-matched redshift sources alone. In all panels, the horizontal black and red lines represent the weighted mean of the Hubble residuals in the NV and HV bins, respectively, where the shaded regions shows the 1σ uncertainty of the weighted means. The vertical dashed grey line represents the criterion (vSi = 12, 000 km s−1) that we used to separate the HV and NV SN Ia samples. The difference of the weighted averages of the HV and NV samples, along with the significances, are shown in each panel.
Current usage metrics show cumulative count of Article Views (full-text article views including HTML views, PDF and ePub downloads, according to the available data) and Abstracts Views on Vision4Press platform.
Data correspond to usage on the plateform after 2015. The current usage metrics is available 48-96 hours after online publication and is updated daily on week days.
Initial download of the metrics may take a while.