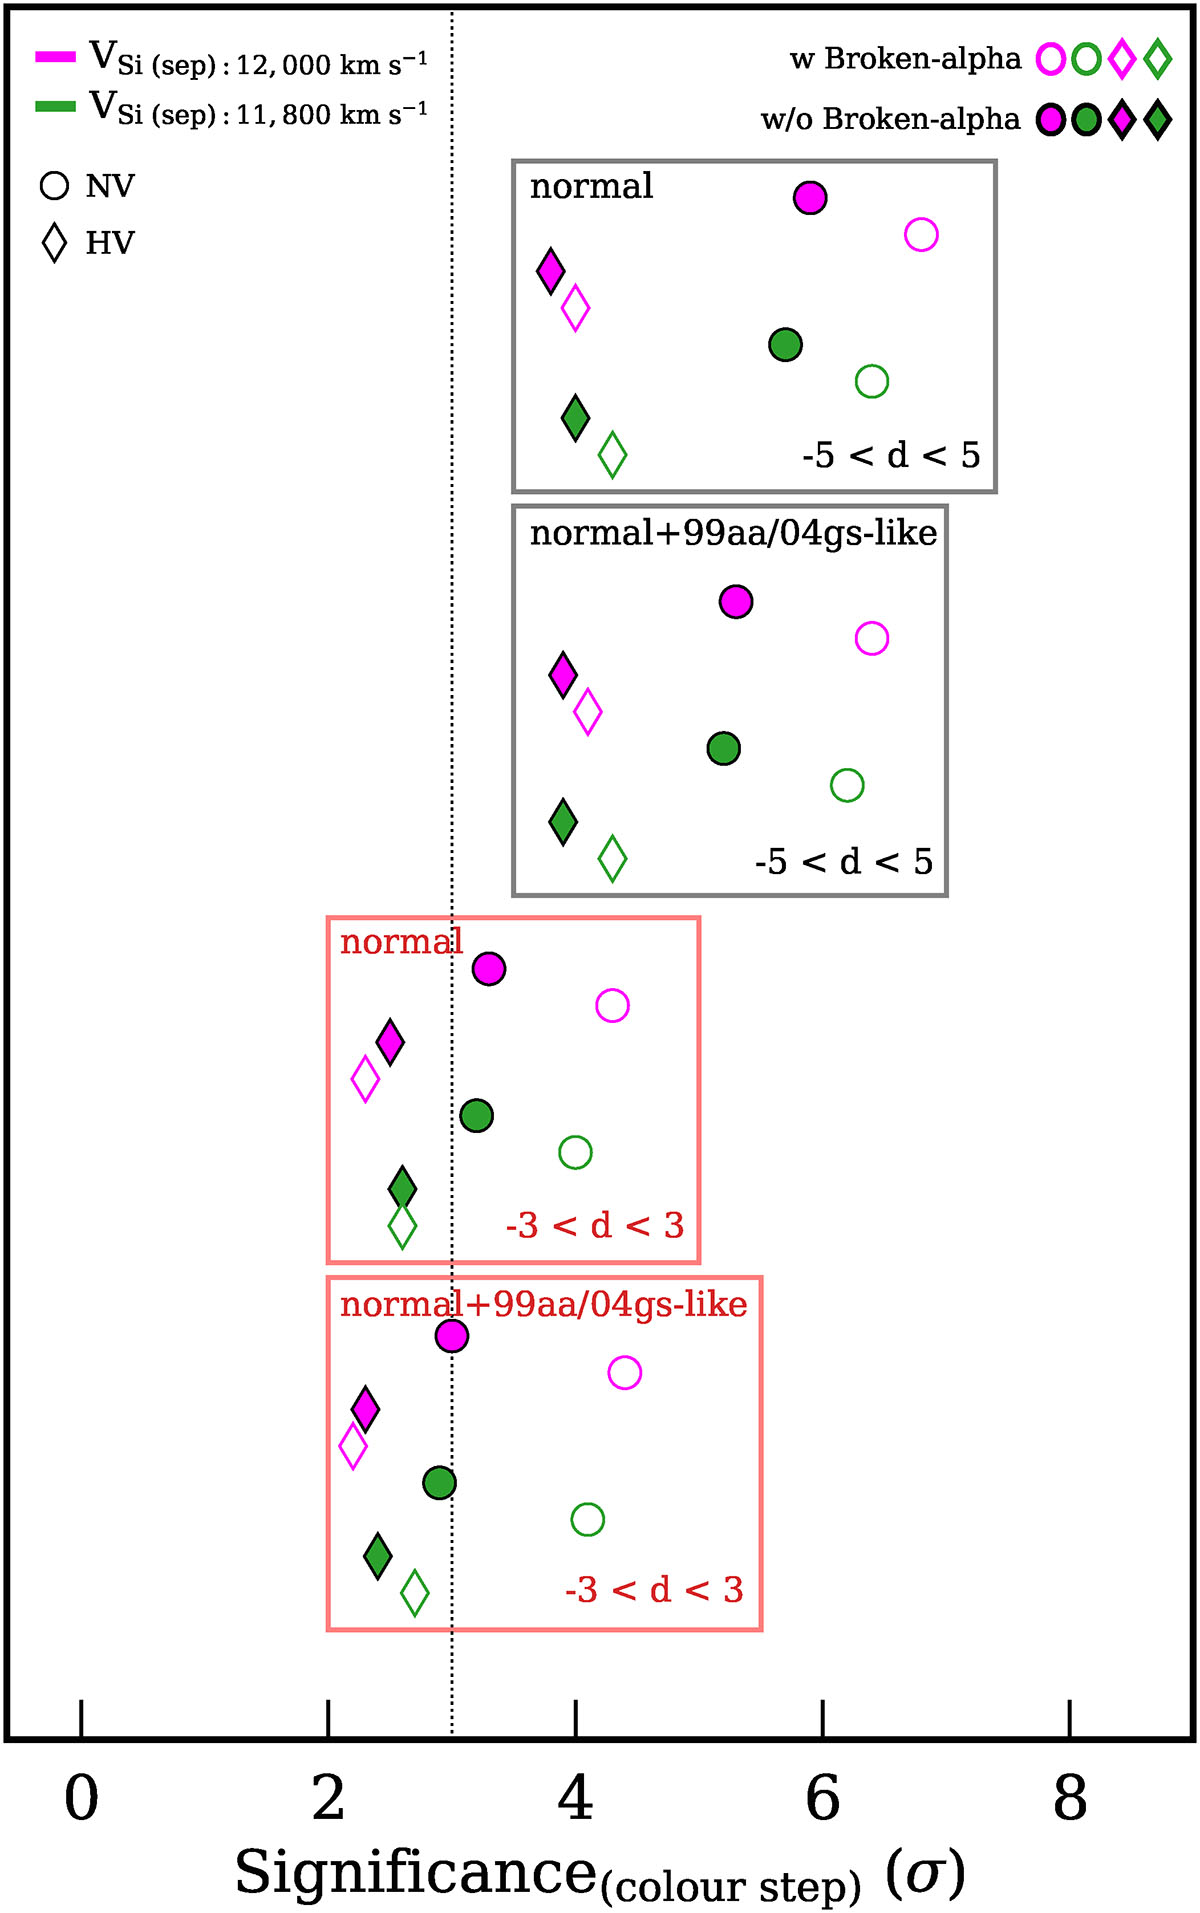
Fig. A.4.
Download original image
Significances of the weighted average Hubble residual differences as a function of global colour (g − z), following the same general analysis as Fig. 3. The circles represent the NV SNe Ia and the diamonds represent the HV SNe Ia. Filled symbols indicate Hubble residuals standardised without the broken-α correction, and unfilled symbols show results with the broken-α correction. Magenta and green colours correspond to velocity splits at 12,000 km s−1 and 11,800 km s−1, respectively. The dashed vertical line marks the significance threshold. The black boxes show the results for samples in which the peak phase is within 5 days and the red boxes show the results in which the peak phase is within 3 days. The sub-types included in each analysis are noted within the boxes.
Current usage metrics show cumulative count of Article Views (full-text article views including HTML views, PDF and ePub downloads, according to the available data) and Abstracts Views on Vision4Press platform.
Data correspond to usage on the plateform after 2015. The current usage metrics is available 48-96 hours after online publication and is updated daily on week days.
Initial download of the metrics may take a while.