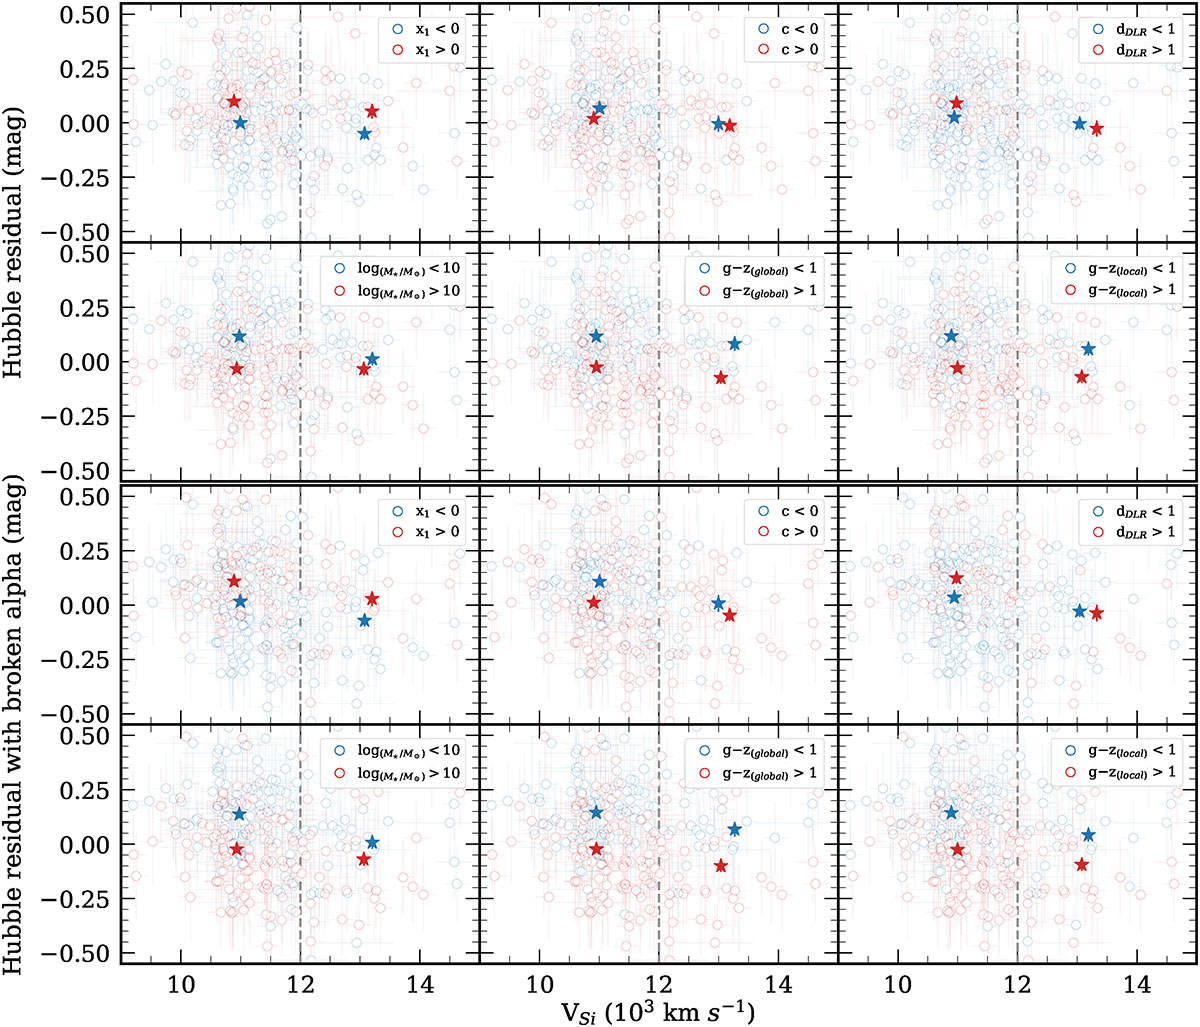
Fig. 2.
Download original image
Hubble residuals without (top two rows) and with (bottom two rows) the broken-α standardisation of HV and NV SNe Ia are shown as a function of Si IIλ6355 velocity (all redshift sources included), separated by low and high values of x1, c, dDLR, host galaxy mass, global colour, and local colour. In each plot, the weighted averages (corresponding to high and low values of the parameter) for HV and NV SNe Ia are shown as stars. The vertical dashed line represents the criterion (vSi = 12, 000 km s−1) we used to separate the HV and NV SN Ia samples. To highlight the relative offsets, the panels show a zoomed-in view of the Hubble residuals. The full-scale version is provided in Appendix A.
Current usage metrics show cumulative count of Article Views (full-text article views including HTML views, PDF and ePub downloads, according to the available data) and Abstracts Views on Vision4Press platform.
Data correspond to usage on the plateform after 2015. The current usage metrics is available 48-96 hours after online publication and is updated daily on week days.
Initial download of the metrics may take a while.