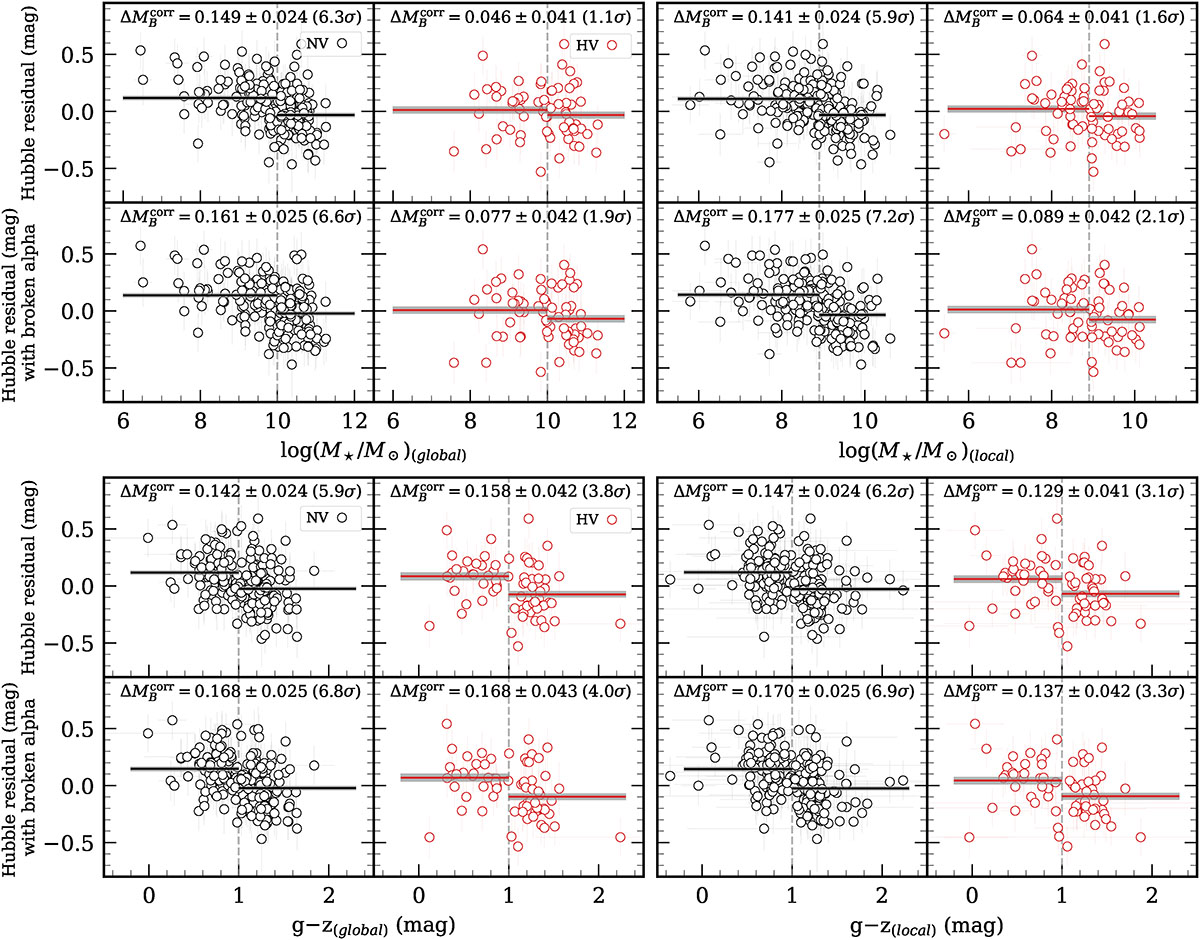
Fig. 3.
Download original image
Hubble residuals as a function of global and local host galaxy mass (top two rows). The top row of plots displays the Hubble residuals without the broken-α standardisation, and the bottom row shows the Hubble residuals with it. In each plot, black circles represent NV SNe Ia, and red circles represent HV SNe Ia. The horizontal black and red lines show the weighted averages of the Hubble residuals for the NV and HV samples, respectively, and the shaded regions represent the 1σ uncertainties of these averages. The vertical dashed lines at log(M★/M⊙) = 10 show the division between low- and high-mass samples based on global host galaxy mass in the left panels, and the dashed lines at log(M★/M⊙) = 8.9 show the division based on local host galaxy mass in the right panels. The difference in the weighted averages between the low- and high-mass samples, along with the corresponding significances, are shown in each panel. The Hubble residuals as a function of global and local g–z colours are shown in the bottom two rows. The vertical dashed line represents the criterion (g–z = 1) we used to separate the low- and high-colour environments.
Current usage metrics show cumulative count of Article Views (full-text article views including HTML views, PDF and ePub downloads, according to the available data) and Abstracts Views on Vision4Press platform.
Data correspond to usage on the plateform after 2015. The current usage metrics is available 48-96 hours after online publication and is updated daily on week days.
Initial download of the metrics may take a while.