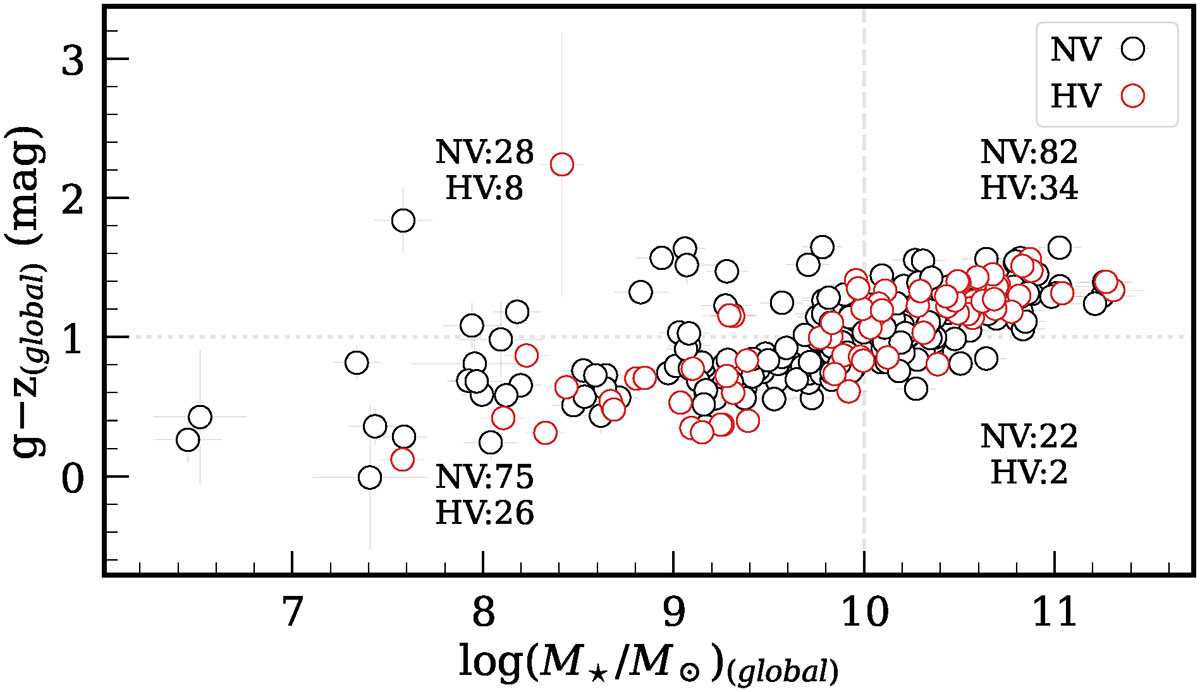
Fig. 6.
Download original image
Distribution of NV and HV SNe Ia across host galaxy mass and global colour. HV and NV SNe Ia are represented with red and black circles, respectively. The vertical dashed line at log(M★/M⊙) = 10 marks the division between low- and high-mass galaxies, and the horizontal dotted line at g–z = 1 marks the division between blue and red hosts.
Current usage metrics show cumulative count of Article Views (full-text article views including HTML views, PDF and ePub downloads, according to the available data) and Abstracts Views on Vision4Press platform.
Data correspond to usage on the plateform after 2015. The current usage metrics is available 48-96 hours after online publication and is updated daily on week days.
Initial download of the metrics may take a while.