Fig. 4
Download original image
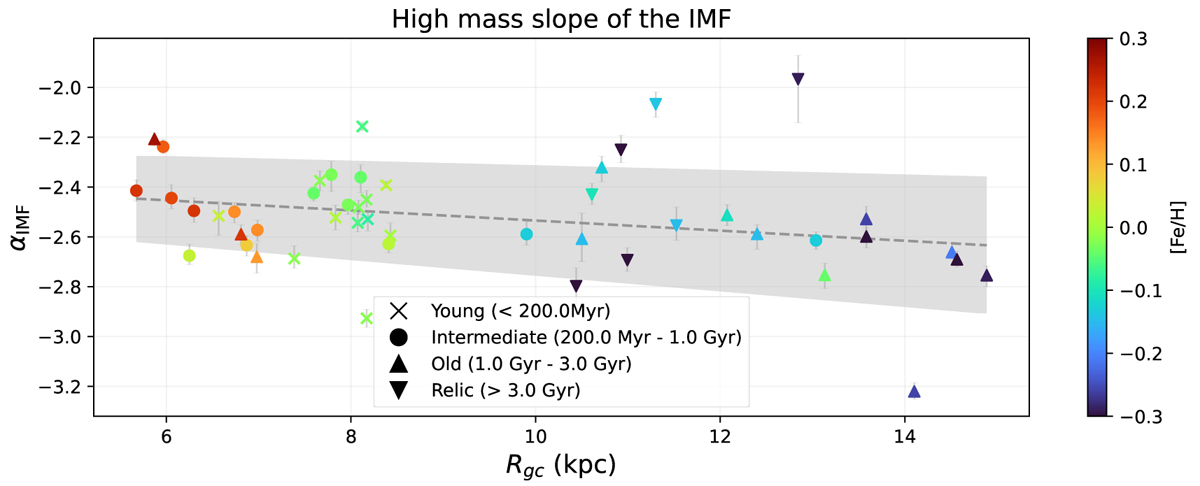
High-mass slope, αIMF, of the IMF versus galactocentric radius, Rgc, for each open cluster. The clusters are coloured by their metallicity [Fe/H] and categorised into four age groups. Error bars are the upper and lower bounds of the inferred parameter from the MCMC algorithm. The dashed line is the mean trend of the whole sample, and the shaded region denotes one σ from this trend. The αIMF trend is ![]() per kpc.
per kpc.
Current usage metrics show cumulative count of Article Views (full-text article views including HTML views, PDF and ePub downloads, according to the available data) and Abstracts Views on Vision4Press platform.
Data correspond to usage on the plateform after 2015. The current usage metrics is available 48-96 hours after online publication and is updated daily on week days.
Initial download of the metrics may take a while.