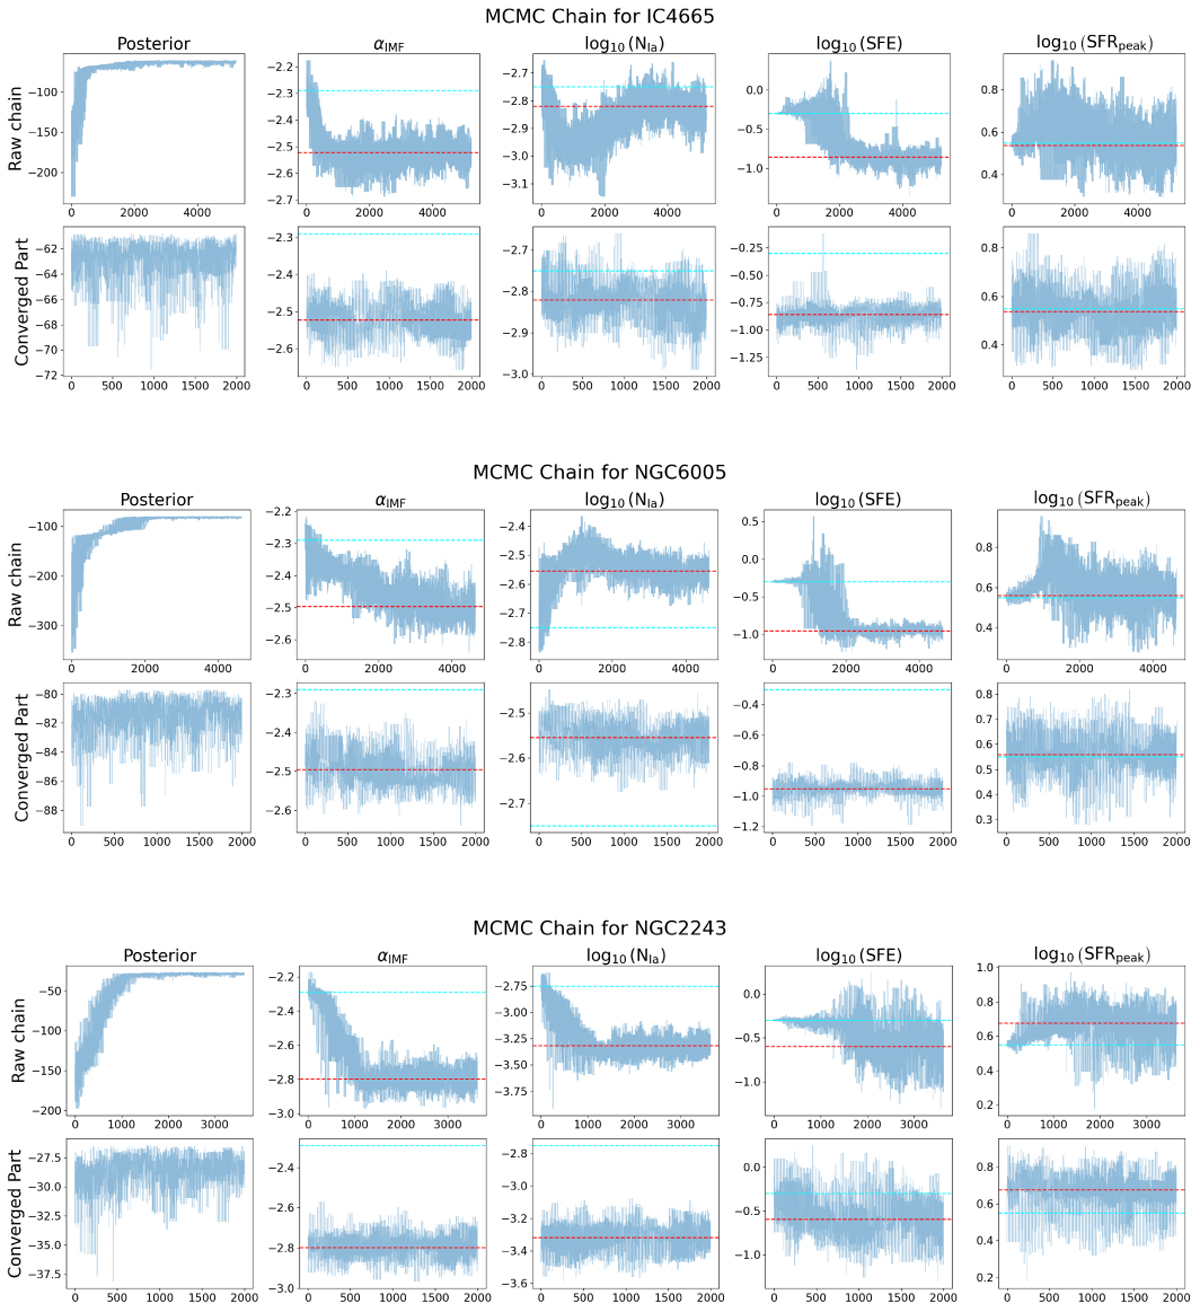
Fig. A.1
Download original image
Markov chain Monte Carlo chains for open clusters IC4665, NGC6005, and NGC2243. The first row shows the raw chain and the second row shows the converged part of the chain. Plots from left to right are posterior, positions for the IMF αIMF, rate of SNIa log10(NIa), star formation efficiency log10(S F E), and the peak and shape of star formation log10(S F Rpeak). The cyan line shows the prior value and the red line shows the best-fit value.
Current usage metrics show cumulative count of Article Views (full-text article views including HTML views, PDF and ePub downloads, according to the available data) and Abstracts Views on Vision4Press platform.
Data correspond to usage on the plateform after 2015. The current usage metrics is available 48-96 hours after online publication and is updated daily on week days.
Initial download of the metrics may take a while.