Fig. 1
Download original image
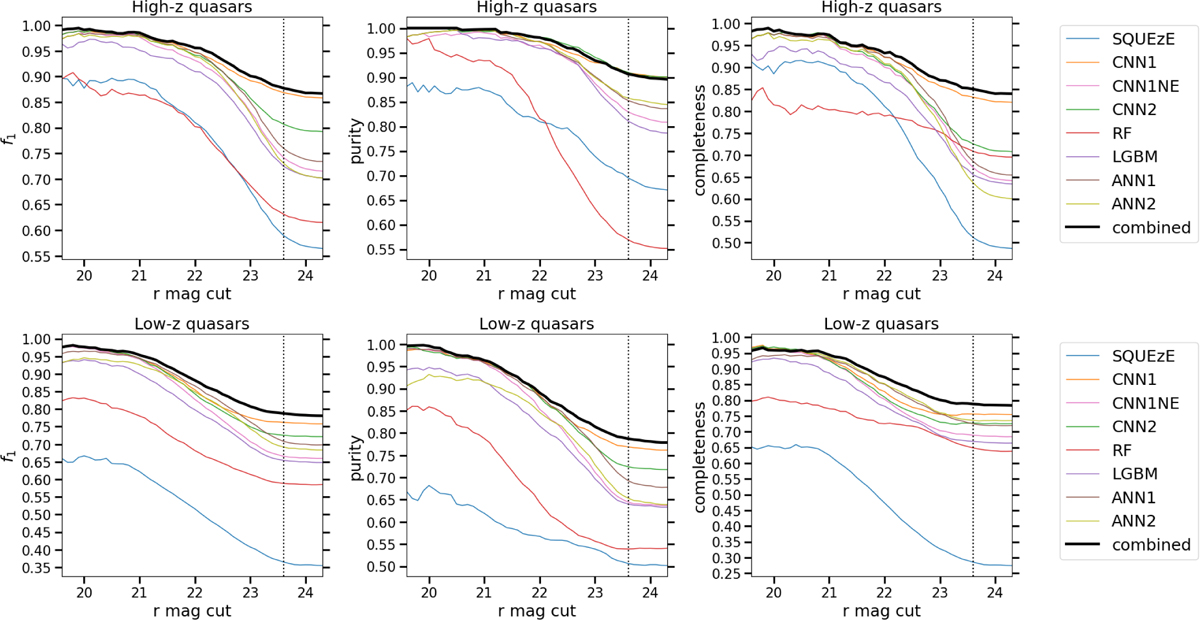
f1 score (left), purity (middle), and completeness (right) versus limiting magnitude for the test sample. The thick solid lines show the performance of the combined algorithm, to be compared with the performance of the individual classifiers (thin lines). The vertical dotted lines show the magnitude limit of the miniJPAS survey (Bonoli et al. 2021). The top panel shows the performance for high-z quasars (with z ≥ 2.1) and the bottom panel the performance for low-z quasars (with z < 2.1). We see that the combined algorithm outperforms the rest.
Current usage metrics show cumulative count of Article Views (full-text article views including HTML views, PDF and ePub downloads, according to the available data) and Abstracts Views on Vision4Press platform.
Data correspond to usage on the plateform after 2015. The current usage metrics is available 48-96 hours after online publication and is updated daily on week days.
Initial download of the metrics may take a while.