Fig. 5
Download original image
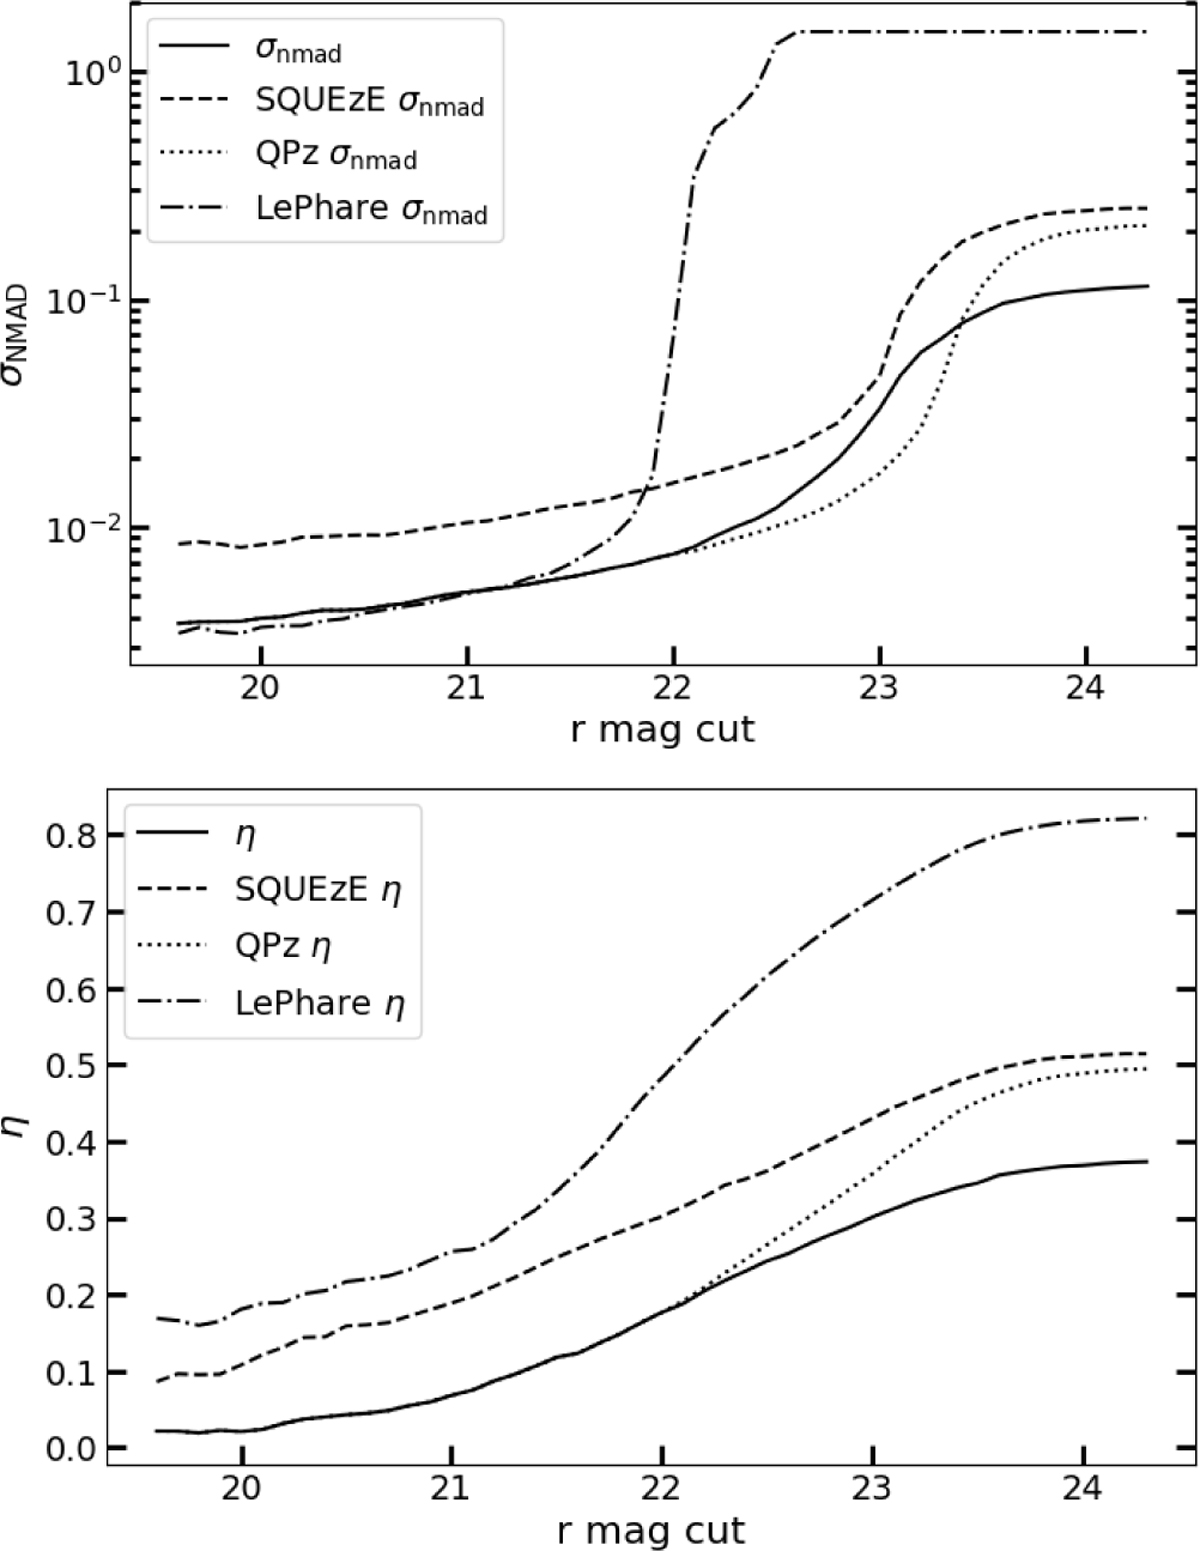
Top panel: evolution of the measured σNMAD as a function of limiting magnitude. The solid line shows the results for our combined algorithm. The other lines show the measured σNMAD for QPz (dotted), the best estimate from SQUEZE (dashed), i.e. Z_SQUEZE_0, and LePhare (dash-dotted). The bottom panel shows the fraction of outliers, i.e. objects with |Δz|/(1 + ztrue) > 0.15, also as a function of limiting magnitude. We can see that, while the recovered σNMAD for the combined algorithm is sometimes larger than that of QPz, this is compensated by a decrease in the outlier fraction.
Current usage metrics show cumulative count of Article Views (full-text article views including HTML views, PDF and ePub downloads, according to the available data) and Abstracts Views on Vision4Press platform.
Data correspond to usage on the plateform after 2015. The current usage metrics is available 48-96 hours after online publication and is updated daily on week days.
Initial download of the metrics may take a while.