Fig. 7
Download original image
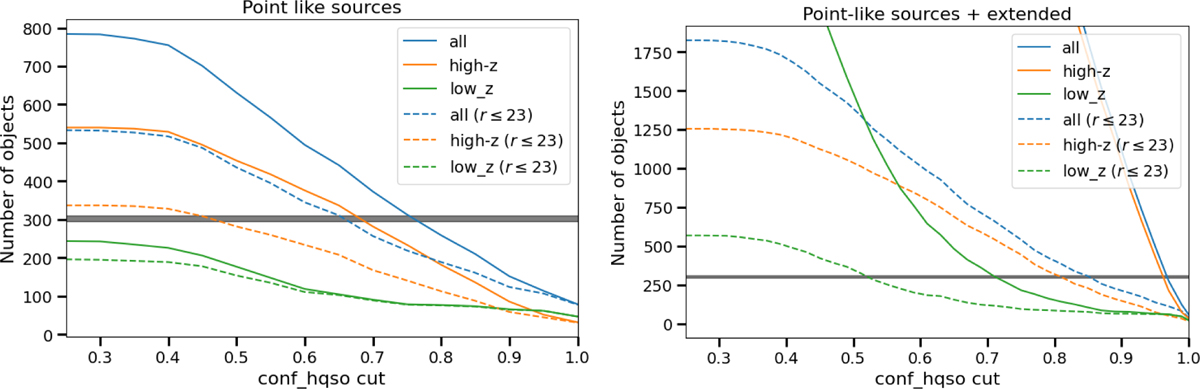
Number of entries in our quasar catalogues as a function of classification confidence. The orange and green lines include the high-z and low-z entries, respectively. The blue lines are the sum of the orange and green lines. Solid lines include all the entries, irrespective of their magnitude, whilst the dashed lines exclude objects fainter than r = 23. Horizontal grey bands indicate the expected number of quasars down to magnitude r = 23 according to the models from Palanque-Delabrouille et al. (2016). The left panel shows the number of objects for the point-like catalogue, and the right panel also includes the extended sources. We note that in the bottom panel, the number of objects including all magnitudes is unreasonably large, and thus we choose to focus the y label on the magnitude-limited lines.
Current usage metrics show cumulative count of Article Views (full-text article views including HTML views, PDF and ePub downloads, according to the available data) and Abstracts Views on Vision4Press platform.
Data correspond to usage on the plateform after 2015. The current usage metrics is available 48-96 hours after online publication and is updated daily on week days.
Initial download of the metrics may take a while.