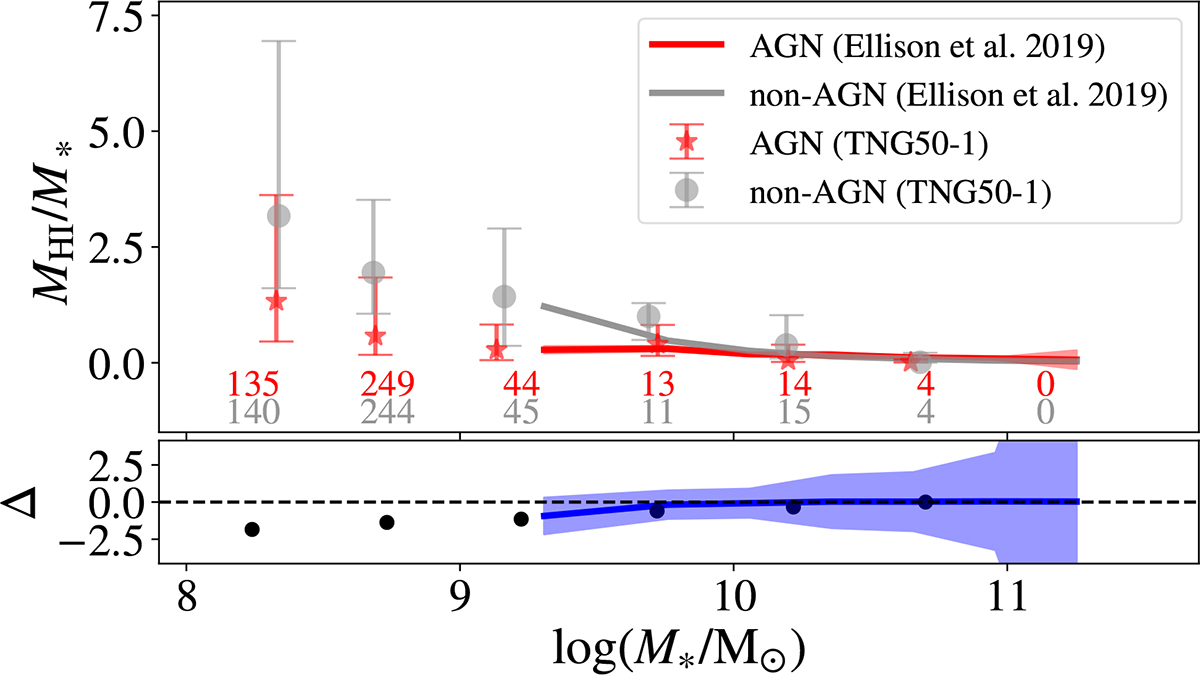
Fig. 11.
Download original image
Median atomic-to-stellar mass ratio (MH I/M*) for AGNs (red stars) and non-AGNs (gray circles) in different stellar mass bins (upper panel) of TNG50-1. Error bars mark the 16th and 84th percentiles for each bin. The small lower panel indicates the difference between the medians of the AGN (λEdd ≥ 0.01) and non-AGN samples. The position of the markers on the x-axis corresponds to the median stellar mass of the galaxies in the bin. The number of objects in each mass bin is indicated by their corresponding colors. The samples of AGNs and non-AGNs are paired by stellar mass and contain only central galaxies. We also plot the MH I/M* values (red and gray solid lines) and uncertainties (shaded regions) reported on Ellison et al. (2019) (their Figure 8), which compares AGNs and non-AGNs in fixed stellar-mass bins. In the bottom panel, we show as a blue line the corresponding AGN-to-non-AGN difference from Ellison et al. (2019).
Current usage metrics show cumulative count of Article Views (full-text article views including HTML views, PDF and ePub downloads, according to the available data) and Abstracts Views on Vision4Press platform.
Data correspond to usage on the plateform after 2015. The current usage metrics is available 48-96 hours after online publication and is updated daily on week days.
Initial download of the metrics may take a while.