Fig. A.5.
Download original image
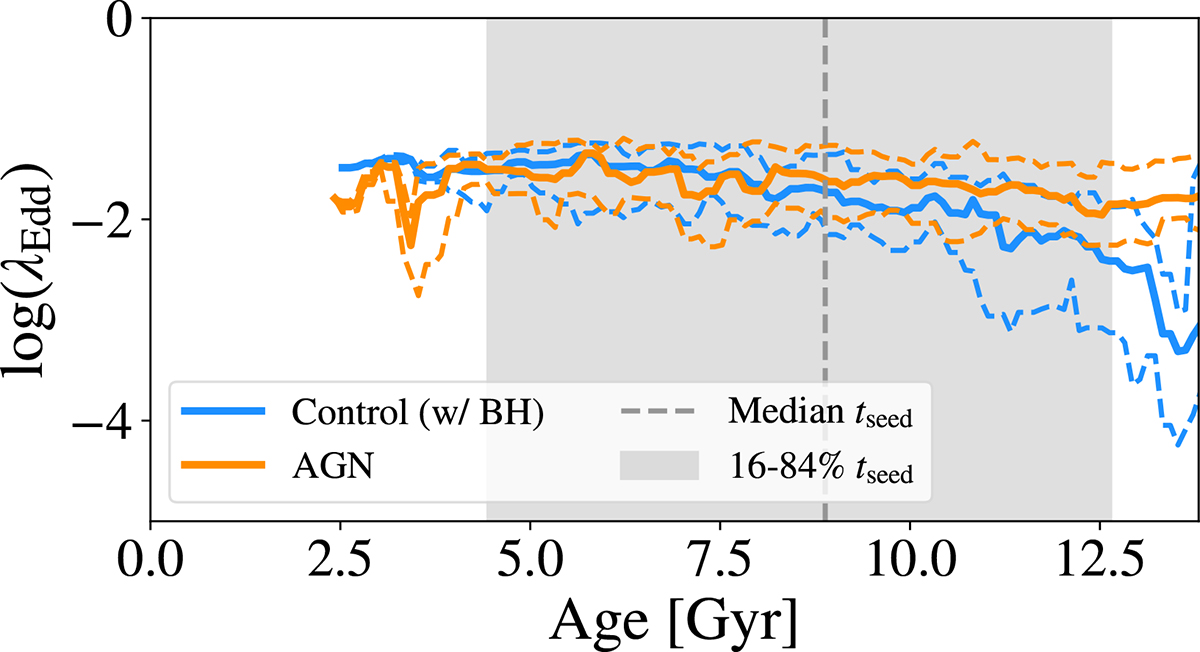
Eddington ratio AGN (orange) and non-AGN control (blue) samples as a function of the age of the Universe. The solid lines indicate the median evolution for the whole sample, while the dashed lines indicate the 16th and 84th percentiles. The vertical dashed line indicates the median black hole seeding time (AGN and non-AGN), and the shaded region encompasses the values between the 16th and 84th percentiles. The samples being compared here are 𝒮M* & M200cWBH and 𝒞M* & M200cWBH.
Current usage metrics show cumulative count of Article Views (full-text article views including HTML views, PDF and ePub downloads, according to the available data) and Abstracts Views on Vision4Press platform.
Data correspond to usage on the plateform after 2015. The current usage metrics is available 48-96 hours after online publication and is updated daily on week days.
Initial download of the metrics may take a while.