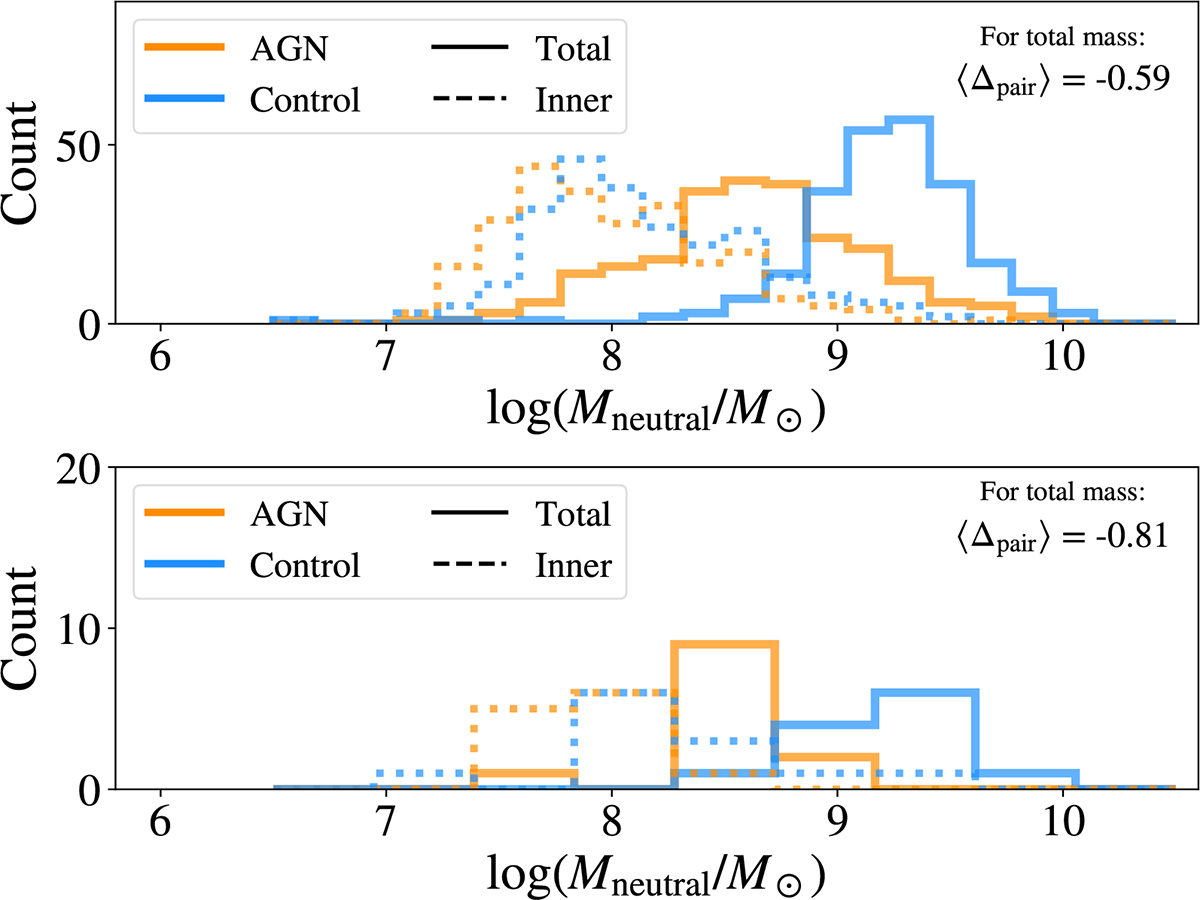
Fig. B.1.
Download original image
Histograms of neutral gas mass in the AGN and non-AGN control galaxies. Colors and line styles are as in the upper panel of Figure 7, but changing the selection criteria of AGN. The upper panel shows the mass distributions for AGN-selected using instantaneous λEdd, and the lower panel shows the mass distributions for AGN-selected using the λEdd, min = 0.05. The samples being compared here are 𝒮M* & M200cWBH and 𝒞M* & M200cWBH.
Current usage metrics show cumulative count of Article Views (full-text article views including HTML views, PDF and ePub downloads, according to the available data) and Abstracts Views on Vision4Press platform.
Data correspond to usage on the plateform after 2015. The current usage metrics is available 48-96 hours after online publication and is updated daily on week days.
Initial download of the metrics may take a while.