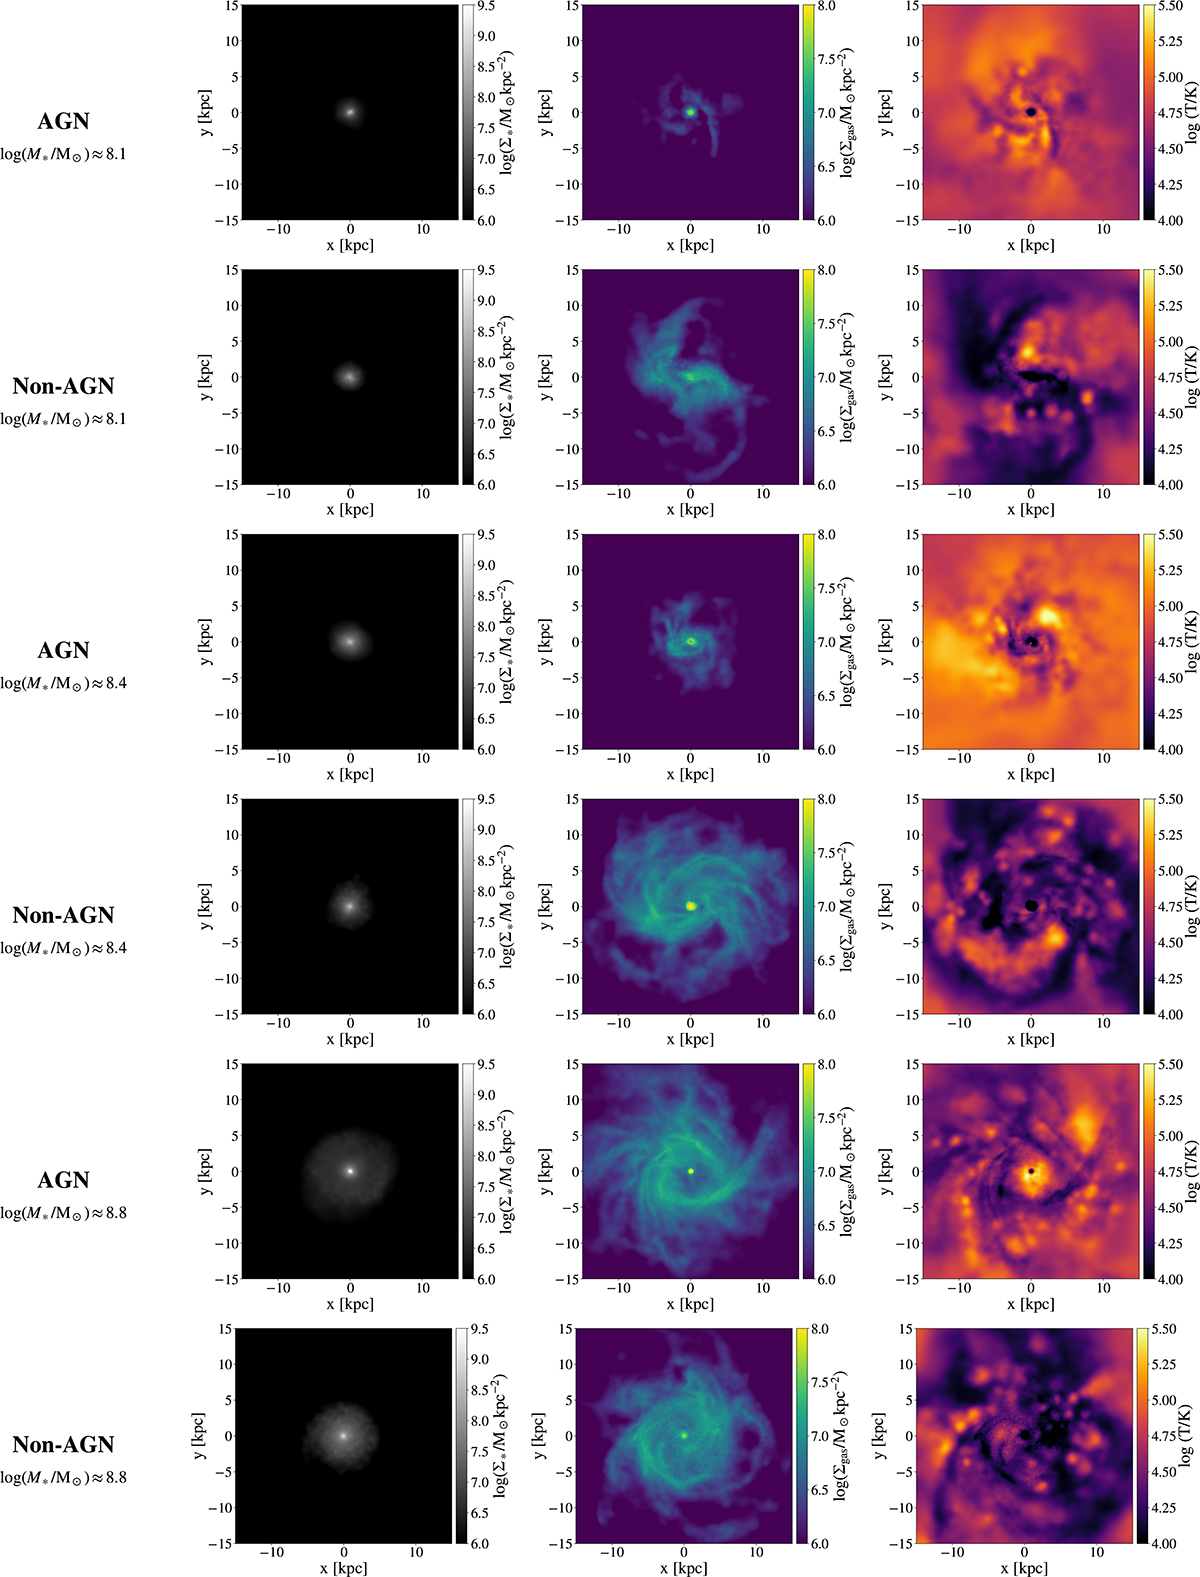
Fig. D.1.
Download original image
Examples of three AGN-control pairs. Each row shows the different maps for a given galaxy in the face-on orientation, from left to right, the quantities are: stellar surface density (Σ*), gas surface density (Σgas), and gas temperature (T). Each two rows represent an AGN-control pair, with AGNs in the upper row and non-AGNs in the lower row for each pair. Stellar masses are indicated on the left of the maps.
Current usage metrics show cumulative count of Article Views (full-text article views including HTML views, PDF and ePub downloads, according to the available data) and Abstracts Views on Vision4Press platform.
Data correspond to usage on the plateform after 2015. The current usage metrics is available 48-96 hours after online publication and is updated daily on week days.
Initial download of the metrics may take a while.