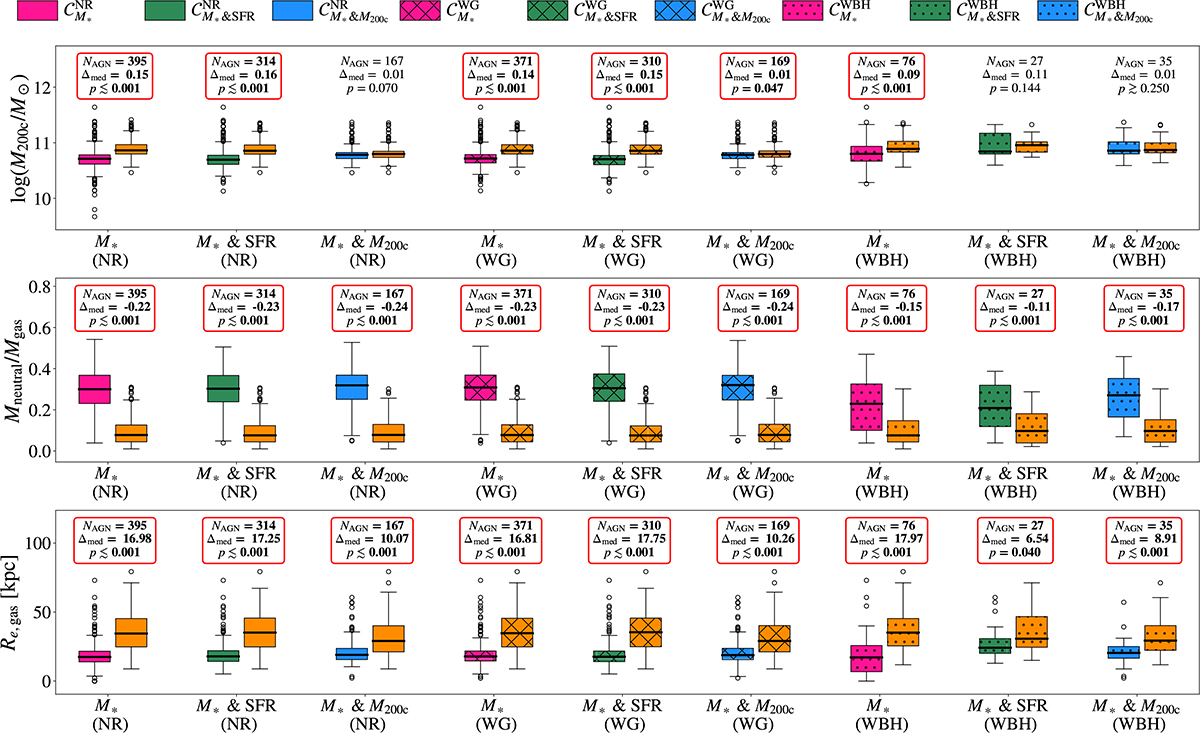
Fig. 4.
Download original image
Box plots of AGN (orange) and non-AGN control (pink, green, blue) sample properties. Each box extends from the first to the third quartile of the data, with a line at the median. The whiskers extend from the box edges to the farthest data point lying within 1.5 times the interquartile range from the box. Data past the end of the whiskers are shown as empty black circles. AGN samples are represented by orange boxes, control samples paired by M*, M* and SFR, or M* and M200c are represented by pink, green, and blue boxes, respectively. Different hatch patterns indicate the different parent samples of non-AGN central galaxies from which the control samples were constructed: no pattern, “x” pattern, and dot pattern refer to the “no restriction” (NR), “with gas” (WG), and “with BH”‘ (WBH) samples, respectively. The legend above the upper panel indicates the color and hatch pattern for each control sample shown in the figure. In each panel, above the boxes, we show the number of AGN hosts (NAGN), the difference between the median of the AGN and control (Δmed), and the p-value of an Anderson-Darling two-sample test performed with the control+AGN paired samples. In the cases where the difference was considered statistically significant (p-value < 0.05), the upper text is highlighted as bold and enclosed in a red box. From top to bottom, the panels show box plots for host halo mass, neutral-to-total gas ratio, and gas half-mass radius.
Current usage metrics show cumulative count of Article Views (full-text article views including HTML views, PDF and ePub downloads, according to the available data) and Abstracts Views on Vision4Press platform.
Data correspond to usage on the plateform after 2015. The current usage metrics is available 48-96 hours after online publication and is updated daily on week days.
Initial download of the metrics may take a while.