Fig. 6.
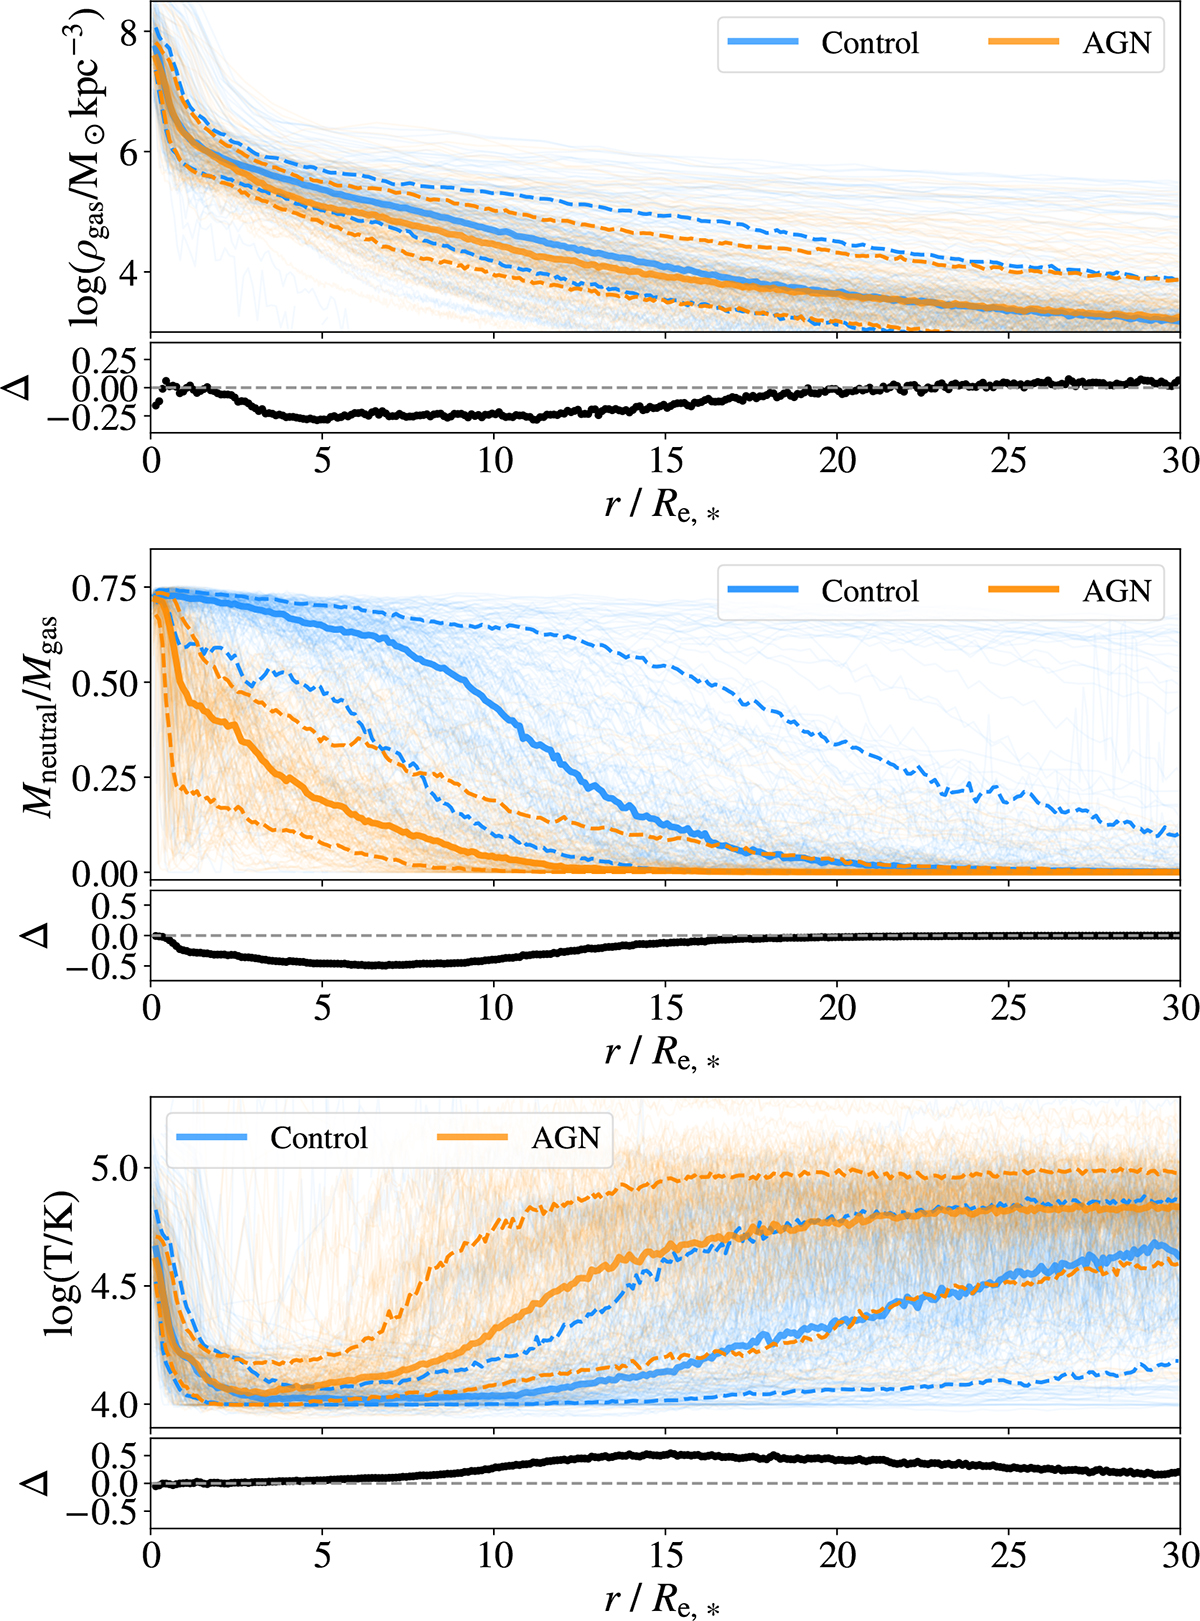
Download original image
Spherical gas profiles of AGN (orange) and non-AGN control (blue) samples. From top to bottom, we show the radial profiles of the volumetric gas density, the neutral-to-total gas mass ratio, and the gas temperature. In both panels, the thin semitransparent lines represent the profiles of individual galaxies, the thick solid lines represent the median profile of the whole sample, and the dashed lines indicate the 16th and 84th percentiles. The radial distance to the galaxy center (r) is rescaled by Re, *. The difference between median AGN and non-AGN profiles for a given quantity (Δ) is shown in black on the lower small sub-panels. The samples being compared here are 𝒮M* & M200cWG and 𝒞M* & M200cWG.
Current usage metrics show cumulative count of Article Views (full-text article views including HTML views, PDF and ePub downloads, according to the available data) and Abstracts Views on Vision4Press platform.
Data correspond to usage on the plateform after 2015. The current usage metrics is available 48-96 hours after online publication and is updated daily on week days.
Initial download of the metrics may take a while.