Fig. 7.
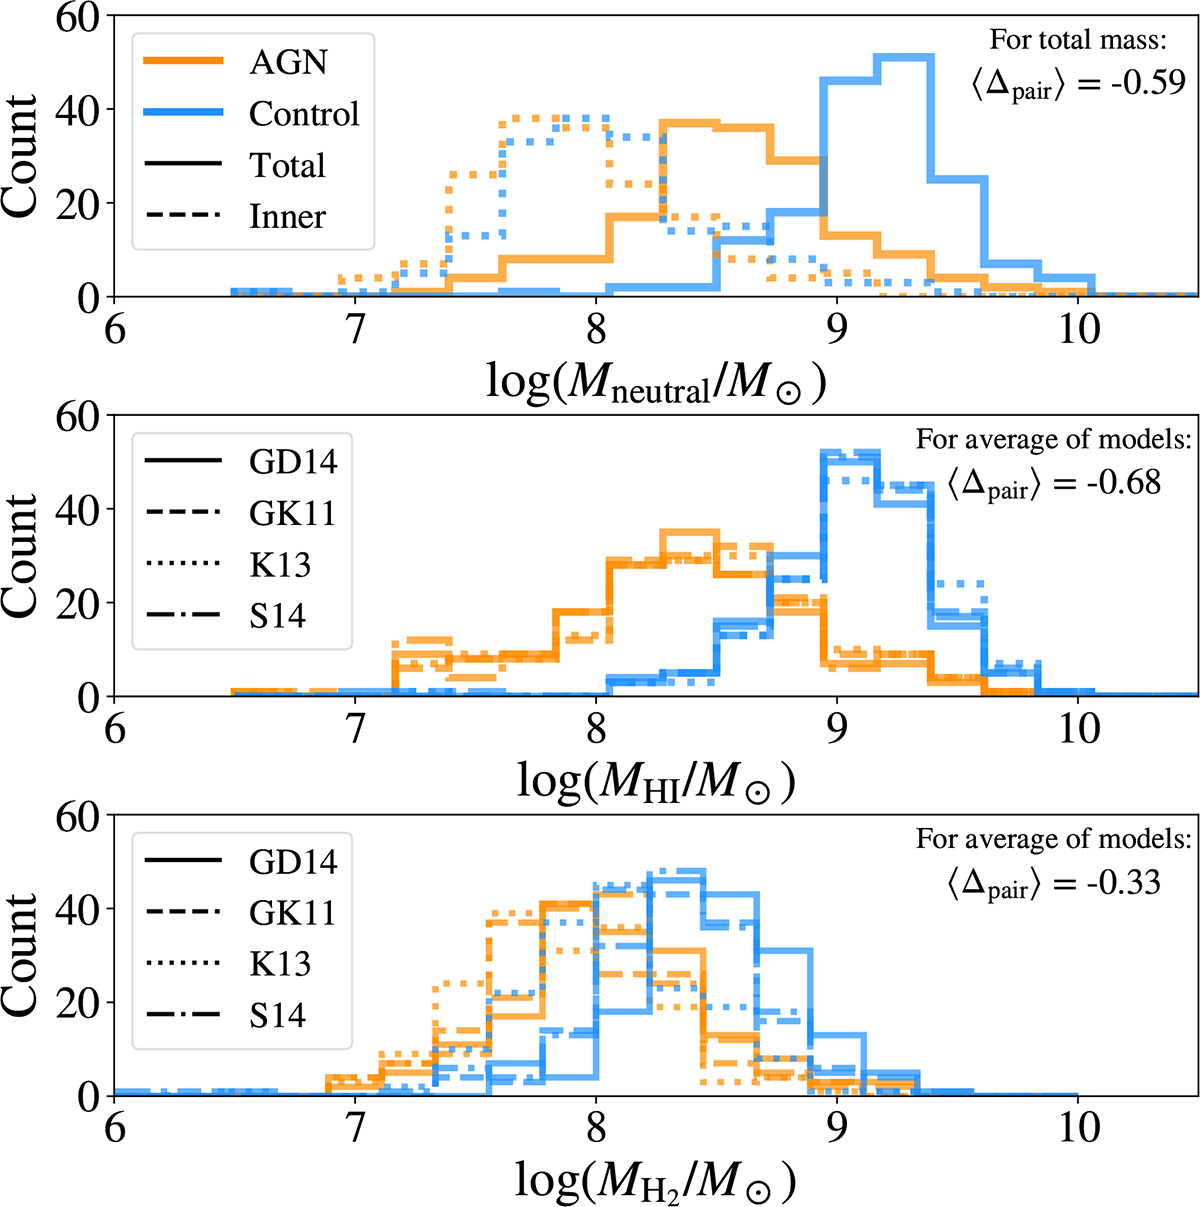
Download original image
Histograms of neutral, neutral atomic (H I), and molecular (H2) gas masses for the AGN (orange) and non-AGN control (blue) samples. The upper panel shows the bound neutral gas masses, with the solid line indicating the total amount and the dashed line indicating only the mass within 2Re, *. The middle and lower panels show the total bound gas masses in the form of H I and H2, taken from the TNG supplementary catalog (Diemer et al. 2019). Each line style of the histograms refers to a type of partition model considered by Diemer et al. (2019) in their post-processing: solid lines are from Gnedin & Draine (2014), dashed lines are from Gnedin & Draine (2014), dotted lines are from Krumholz (2013), and dotted-dashed lines are from Sternberg et al. (2014). Here, we show different models to illustrate variations in the values of MH I and MH2. In the upper right of each panel, we show the average pair-wise differences (Δpair) between the AGN and non-AGN logarithmic masses. The samples being compared here are 𝒮M* & M200cWG and 𝒞M* & M200cWG.
Current usage metrics show cumulative count of Article Views (full-text article views including HTML views, PDF and ePub downloads, according to the available data) and Abstracts Views on Vision4Press platform.
Data correspond to usage on the plateform after 2015. The current usage metrics is available 48-96 hours after online publication and is updated daily on week days.
Initial download of the metrics may take a while.