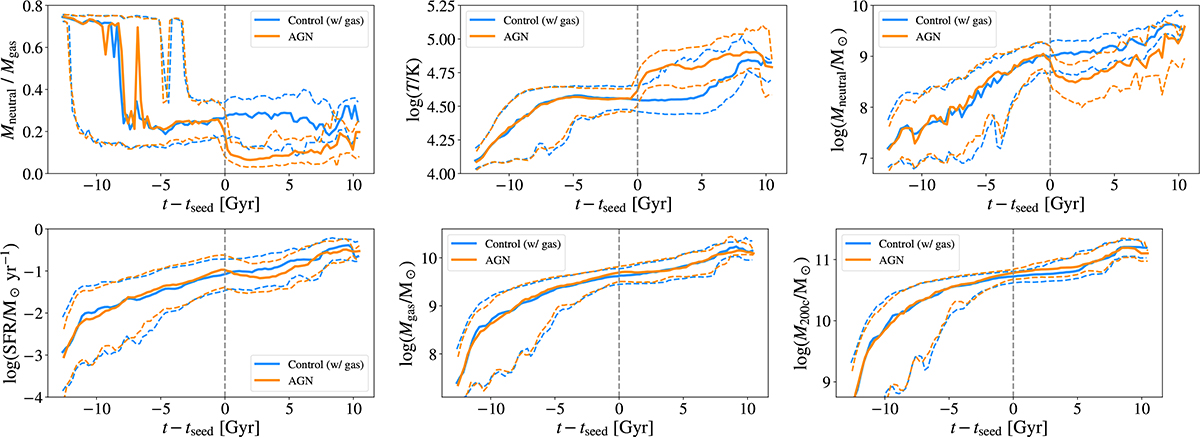
Fig. 8.
Download original image
Evolution of properties in AGN (orange) and non-AGN control (blue) samples. The time variable on the horizontal axis is the cosmic time minus the seeding time (tseed) of the AGN host. where the median tseed is 11 Gyr, and the 16th (84th) percentile is 7.3 Gyr (13 Gyr). From top to bottom and left to right, each panel represents the evolution of the neutral-to-total gas ratio, gas temperature, neutral gas mass, star formation rate, total gas mass, and host halo mass. All bound gas particles are considered. The solid lines indicate the median evolution of a given quantity for the whole sample, while the dashed lines indicate the 16th and 84th percentiles. Different from Figure 6, here we choose not to plot the data of each galaxy for better visualization. The samples being compared here are 𝒮M* & M200cWG and 𝒞M* & M200cWG.
Current usage metrics show cumulative count of Article Views (full-text article views including HTML views, PDF and ePub downloads, according to the available data) and Abstracts Views on Vision4Press platform.
Data correspond to usage on the plateform after 2015. The current usage metrics is available 48-96 hours after online publication and is updated daily on week days.
Initial download of the metrics may take a while.