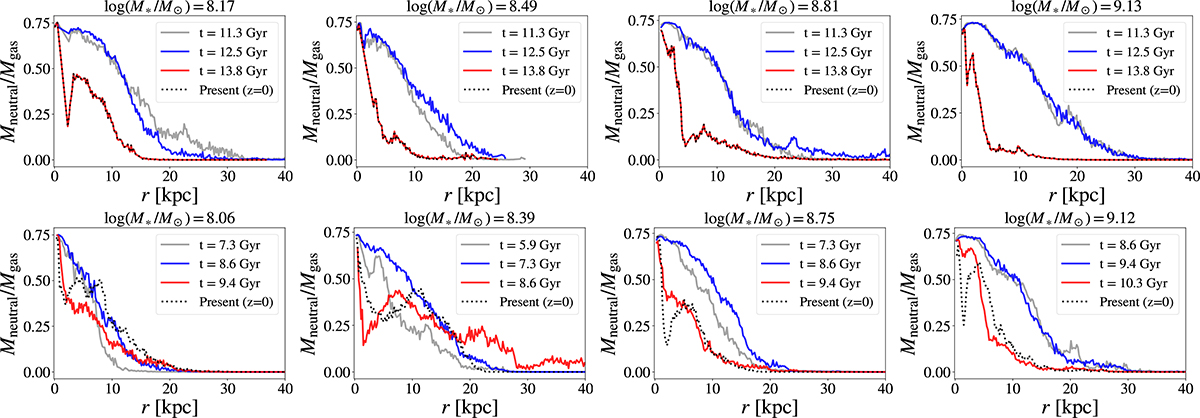
Fig. 9.
Download original image
Examples of neutral-to-total gas profile evolution for a few AGNs selected at z = 0. In each panel, we show the profile of a specific galaxy at different times, before and after the black hole seeding. The two latest available profiles before tseed are shown as blue and gray solid lines, the earliest available profile after tseed is shown as a red solid line, and the present profile is shown as a black dotted line. The availability of the profiles depends on the type of simulation snapshot; see Section 2.3 for details. Each row is dedicated to a bin of black hole seeding times, in the top row tseed < 1 Gyr, and in the bottom row tseed > 3 Gyr. From left to right: Stellar mass of the example galaxies increasing in bins of roughly 0.25 dex.
Current usage metrics show cumulative count of Article Views (full-text article views including HTML views, PDF and ePub downloads, according to the available data) and Abstracts Views on Vision4Press platform.
Data correspond to usage on the plateform after 2015. The current usage metrics is available 48-96 hours after online publication and is updated daily on week days.
Initial download of the metrics may take a while.