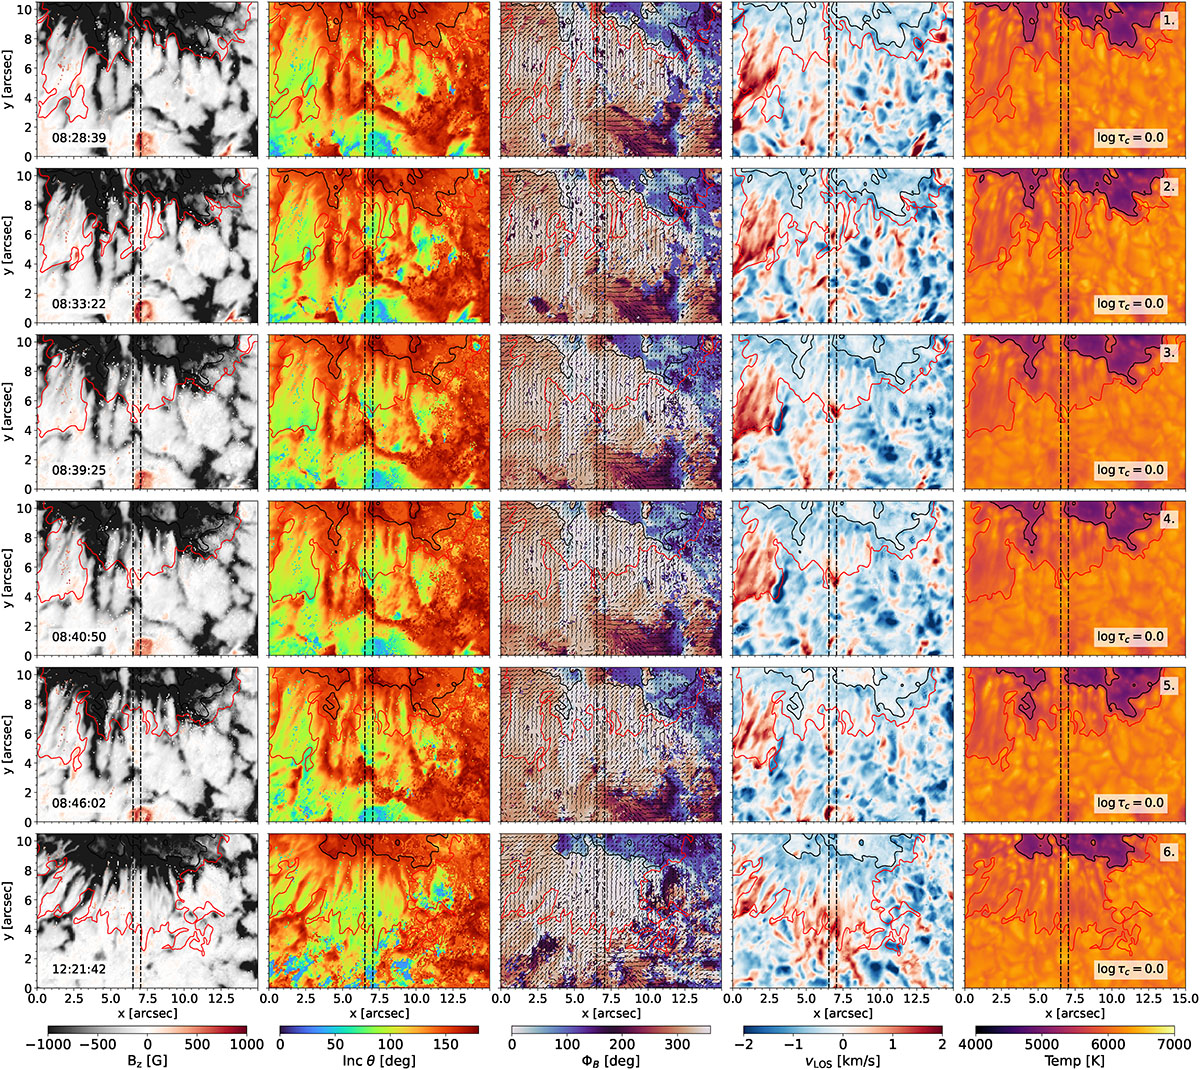
Fig. A.1.
Download original image
Inverted maps from STiC at log τc = 0.0, representative of the photosphere. From left to right: Vertical magnetic field strength, inclination, azimuth, LOS velocity, vLOS component, and temperature. The black contours indicate the size of the umbra, and the red contours mark the extent of the penumbra. The vertical dashed lines indicate where we made vertical cuts to analyze the vertical structure of the solar atmosphere. The magnetic field results are transformed to LRF.
Current usage metrics show cumulative count of Article Views (full-text article views including HTML views, PDF and ePub downloads, according to the available data) and Abstracts Views on Vision4Press platform.
Data correspond to usage on the plateform after 2015. The current usage metrics is available 48-96 hours after online publication and is updated daily on week days.
Initial download of the metrics may take a while.