Fig. 2.
Download original image
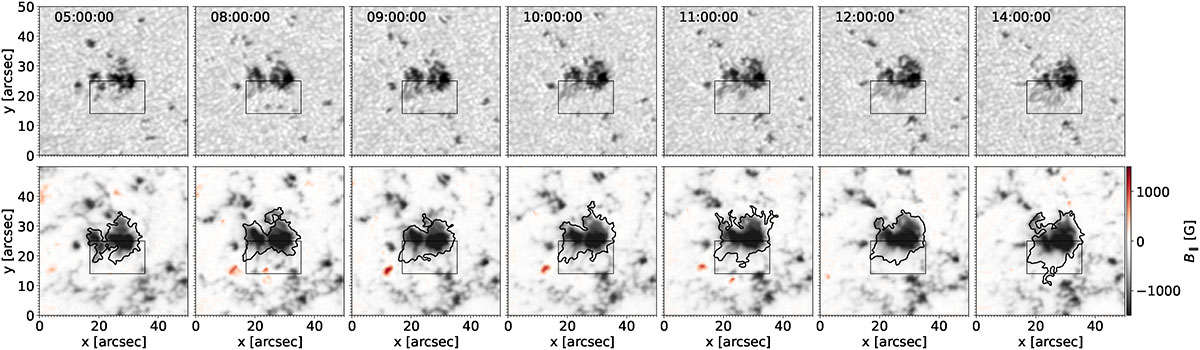
Detailed evolution of the sunspot. The upper panel displays the continuum intensity image for reference, and the lower panel shows the vertical magnetic field in the local reference frame. To cover the most important times of the penumbra formation, we display one HMI frame each hour between 08:00 and 12:00, and additionally one frame at 05:00, roughly three hours before the SST observations, and one frame at 14:00, roughly two hours after our last observation. The small black box indicates FOV selection, which we inverted with STiC.
Current usage metrics show cumulative count of Article Views (full-text article views including HTML views, PDF and ePub downloads, according to the available data) and Abstracts Views on Vision4Press platform.
Data correspond to usage on the plateform after 2015. The current usage metrics is available 48-96 hours after online publication and is updated daily on week days.
Initial download of the metrics may take a while.