Fig. 3.
Download original image
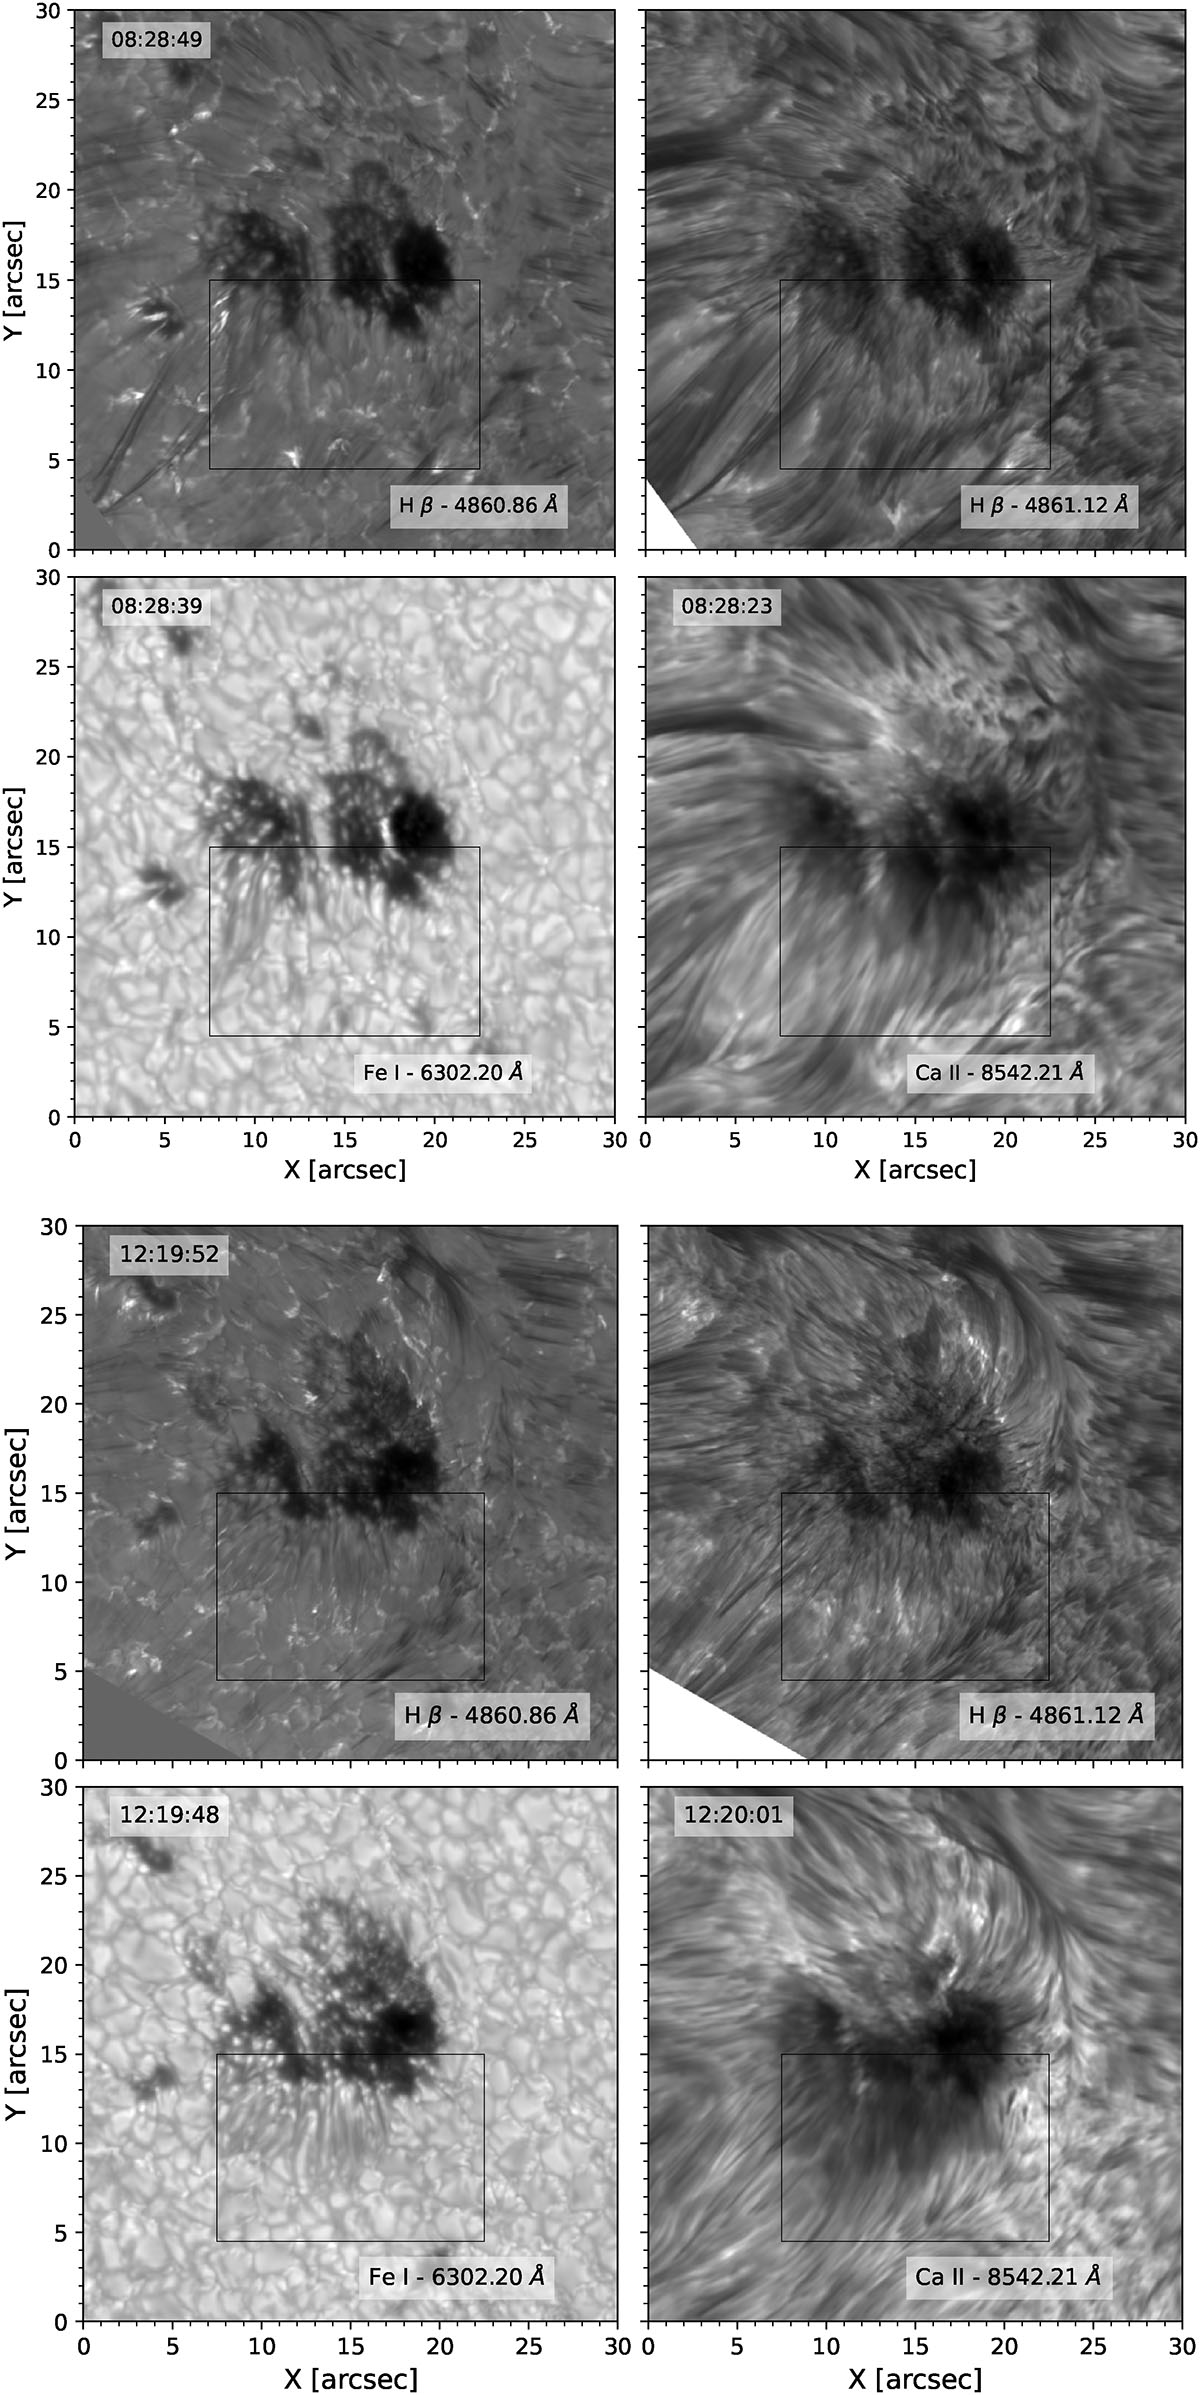
Overview image of the observation at 08:28 (upper set of panels) and 12:19 (lower set of panels). In each set of panels, the upper left panel shows the Hβ far wing image, the upper right panel the Hβ core forming in the chromosphere, the lower left panel shows the continuum image in Fe I 6302 Å and the lower right the line core of Ca II 8542 Å, also forming in the chromosphere. The black box indicates where we selected a subframe to invert the data with STiC.
Current usage metrics show cumulative count of Article Views (full-text article views including HTML views, PDF and ePub downloads, according to the available data) and Abstracts Views on Vision4Press platform.
Data correspond to usage on the plateform after 2015. The current usage metrics is available 48-96 hours after online publication and is updated daily on week days.
Initial download of the metrics may take a while.