Fig. 7.
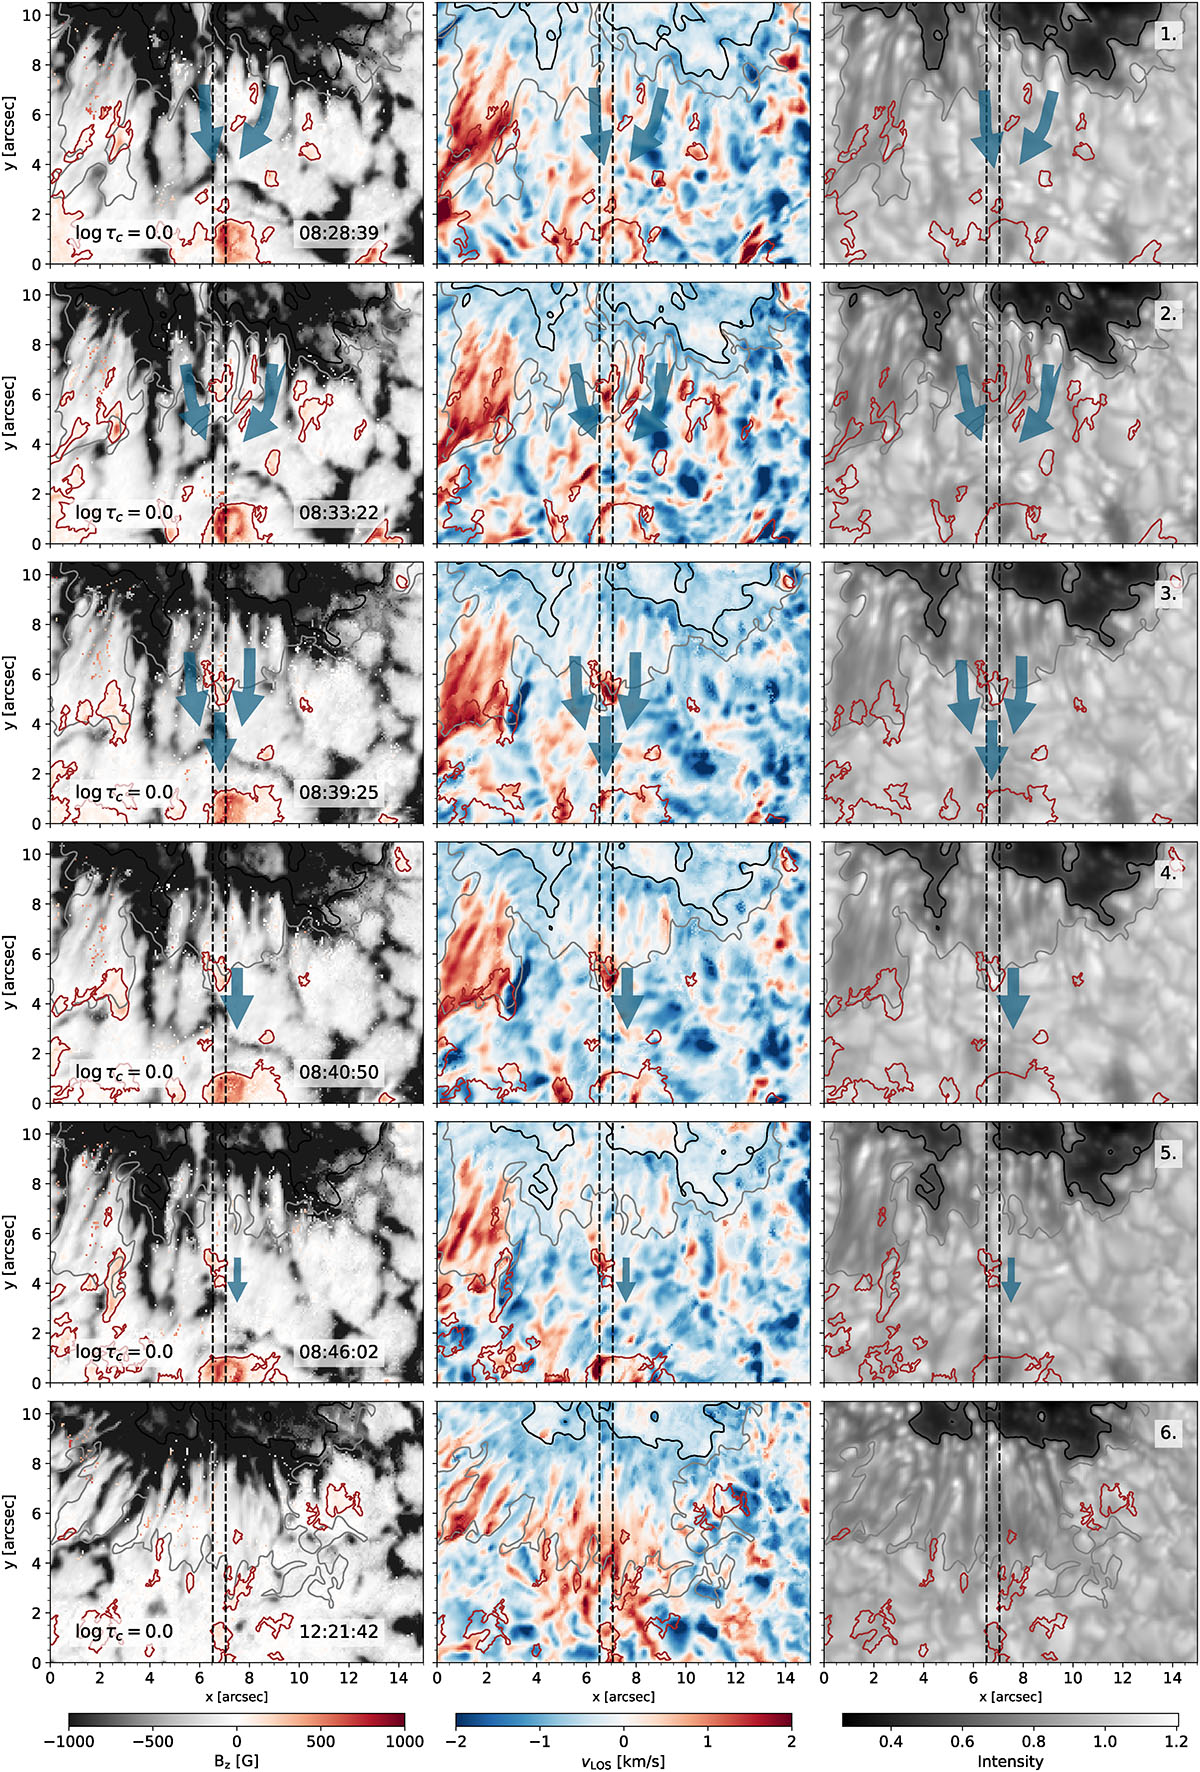
Download original image
STiC inversion result maps (vertical magnetic field, Bz, LOS velocity, vLOS, and Fe I wing intensity) of the region of interest marked in Fig. 3. Dark red contours indicate where the vertical magnetic field exceeds 20 G, to better follow the evolution of the positive magnetic flux patch. Arrows are drawn to indicate the flow pattern of the emerging flux. Gray and black contours indicate the size of the penumbra and umbra, respectively. Within the area marked by the vertical dashed lines, the vertical structure of the atmosphere is analyzed in more detail.
Current usage metrics show cumulative count of Article Views (full-text article views including HTML views, PDF and ePub downloads, according to the available data) and Abstracts Views on Vision4Press platform.
Data correspond to usage on the plateform after 2015. The current usage metrics is available 48-96 hours after online publication and is updated daily on week days.
Initial download of the metrics may take a while.