Open Access
Fig. 8.
Download original image
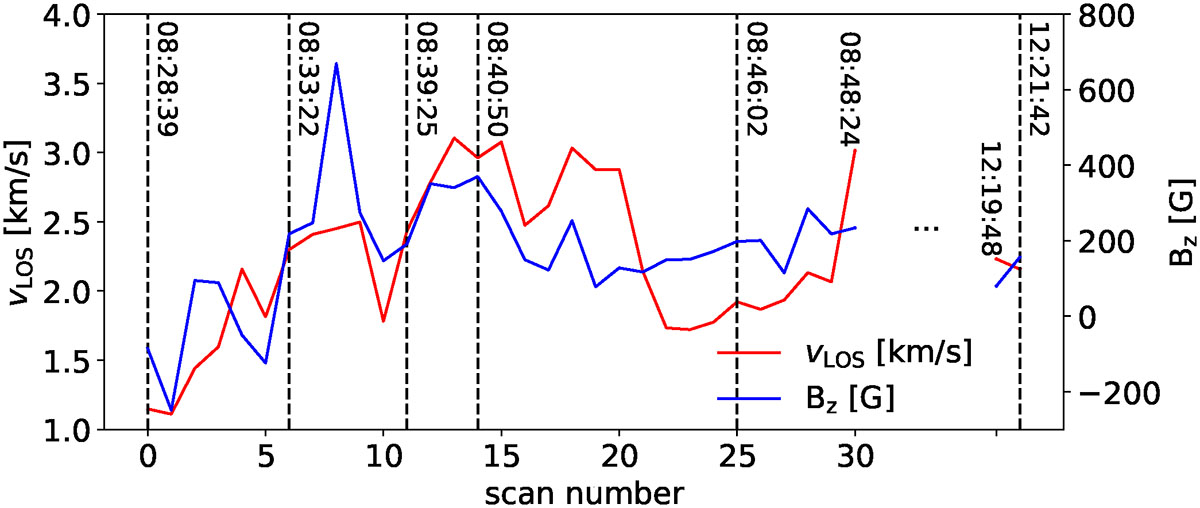
Temporal evolution of the vertical velocity (red) and vertical magnetic field strength (blue) at the location of maximum velocity as seen in the velocity maps of Fig. 6. The vertical dashed lines indicate the timestamps for which we present the results.
Current usage metrics show cumulative count of Article Views (full-text article views including HTML views, PDF and ePub downloads, according to the available data) and Abstracts Views on Vision4Press platform.
Data correspond to usage on the plateform after 2015. The current usage metrics is available 48-96 hours after online publication and is updated daily on week days.
Initial download of the metrics may take a while.