Fig. 1
Download original image
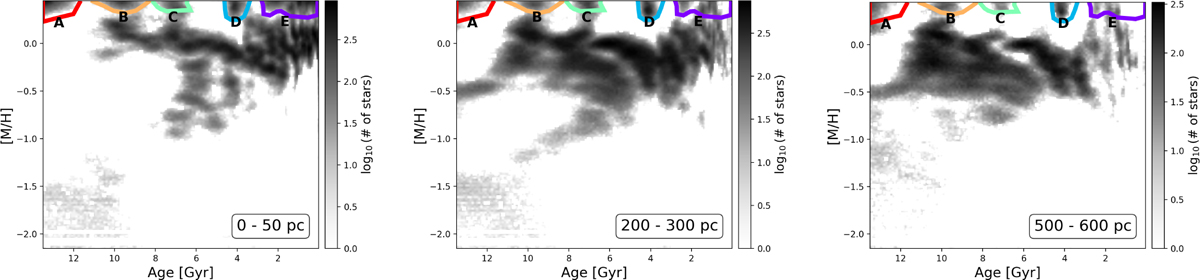
Stellar density distribution in the age-metallicity plane for volumes 1, 5, and 8 (i.e. from the plane to 50 pc, 0.2-0.3 kpc, and 0.5-0.6 kpc, respectively, above and below the plane) as representative examples of the reported super-metal-rich populations (for these we used the Lallement et al. 2022 dust map). Coloured polygons delimit the areas in the age-metallicity plane used to quantify the z-profiles in Fig. 2. Note that a logarithmic scale has been used to represent the number of stars in order to enhance these relatively low-intensity features.
Current usage metrics show cumulative count of Article Views (full-text article views including HTML views, PDF and ePub downloads, according to the available data) and Abstracts Views on Vision4Press platform.
Data correspond to usage on the plateform after 2015. The current usage metrics is available 48-96 hours after online publication and is updated daily on week days.
Initial download of the metrics may take a while.