| Issue |
A&A
Volume 705, January 2026
|
|
|---|---|---|
| Article Number | A92 | |
| Number of page(s) | 10 | |
| Section | Galactic structure, stellar clusters and populations | |
| DOI | https://doi.org/10.1051/0004-6361/202556468 | |
| Published online | 09 January 2026 | |
Chronology of our Galaxy from Gaia colour-magnitude diagram fitting (ChronoGal)
IV. The inner Milky Way stellar age distribution
1
Universidad de Granada, Departamento de Física Teórica y del Cosmos,
Campus Fuente Nueva, Edificio Mecenas,
18071
Granada,
Spain
2
Instituto Carlos I de Física Teórica y Computacional, Facultad de Ciencias,
18071
Granada,
Spain
3
Instituto de Astrofísica de Canarias,
Calle Vía Láctea s/n,
38206
La Laguna,
Tenerife,
Spain
4
Departamento de Astrofísica, Universidad de La Laguna,
38205
La Laguna,
Tenerife,
Spain
5
Astrophysics Research Institute, Liverpool John Moores University,
146 Brownlow Hill,
Liverpool
L3 5RF,
UK
6
Institute for Computational Cosmology, Department of Physics, Durham University,
South Road,
Durham
DH1 3LE,
UK
7
INAF – Osservatorio Astronomico d’Abruzzo,
Via Mentore Maggini s.n.c.,
64100
Teramo,
Italy
8
INFN, Sezione di Pisa,
Largo Pontecorvo 3,
56127
Pisa,
Italy
9
Department of Astrophysics, University of Zurich,
Zurich,
Switzerland
10
Departamento de Astronomía, Universidad de La Serena,
Av. Juan Cisternas 1200 Norte,
La Serena,
Chile
11
Max-Planck-Institute for Astrophysics,
Karl-Schwartzschild-Strasse 1,
85748
Garching,
Germany
12
Cardiff Hub for Astrophysics Research and Technology, School of Physics and Astronomy, Cardiff University,
Queen’s Buildings,
Cardiff
CF24 3AA,
UK
★ Corresponding author: This email address is being protected from spambots. You need JavaScript enabled to view it.
Received:
17
July
2025
Accepted:
26
September
2025
Abstract
The Milky Way’s inner region is dominated by a stellar bar and a boxy-peanut-shaped bulge. However, which stellar populations inhabit the inner Galaxy or how star formation proceeded there is still unknown. The difficulty in studying these stars stems from their location in dense regions that are strongly impacted by extinction and crowding effects. In this work we used star formation histories computed in the solar neighbourhood via Gaia colour-magnitude diagram fitting to shed light on the evolution of the central regions of our Galaxy. For that, we obtained precise age distributions for the non-negligible amount of super-metal-rich stars ([M/H] ∼ 0.5) in the solar neighbourhood (more than 5% of the total stars within 400 pc of the plane). Assuming that these stars were born in the inner Galaxy and migrated outwards, those distributions should be indicative of the true stellar age distribution in the inner Galaxy. Surprisingly, we find that these age distributions are not continuous but show clear signs of episodic star formation (∼13.5, 10.0, 7.0, 4.0, 2.0, and less than 1 Gyr ago). Interestingly, with the exception of the 4 Gyr event, the timings of the detected events coincide with the formation of the primitive Milky Way and with known merging events or satellite encounters (Gaia-Enceladus-Sausage, Sagittarius dwarf galaxy, and the Magellanic Clouds), suggesting that these events could have triggered global star-forming episodes. These results are compatible with a scenario in which Gaia-Enceladus-Sausage is responsible for the formation of the bar 10 Gyr ago. However, we cannot associate any accretion counterpart with the event that occurred 4 Gyr ago, leaving open the possibility of a late formation of the bar, as previously proposed. The Auriga Superstars simulations also indicate that metal-rich stars in the solar neighbourhood-like regions formed at discrete times and migrated from the inner parts of barred galaxies, suggesting a possible link to bar dynamics and satellite accretion. This novel analysis allows us to indirectly witness the evolution of the inner Milky Way and constrain dynamical models of the Milky Way bar.
Key words: Hertzsprung-Russell and C-M diagrams / Galaxy: disk / Galaxy: evolution / solar neighborhood / Galaxy: stellar content
© The Authors 2026
 Open Access article, published by EDP Sciences, under the terms of the Creative Commons Attribution License (https://creativecommons.org/licenses/by/4.0), which permits unrestricted use, distribution, and reproduction in any medium, provided the original work is properly cited.
This article is published in open access under the Subscribe to Open model. This email address is being protected from spambots. You need JavaScript enabled to view it. to support open access publication.
1 Introduction
There is a clear consensus that our Galaxy has a barred nature (e.g. Stanek et al. 1994; McWilliam & Zoccali 2010; Saito et al. 2011, 2012; Anders et al. 2019). In addition, detailed studies of the kinematics of stars populating the inner Galaxy show that a large fraction of stars follow a cylindrical rotation (e.g. Sumi et al. 2003; Howard et al. 2009; Shen et al. 2010), indicative of a secular, boxy-peanut bulge (see also Dwek et al. 1995; Wegg & Gerhard 2013) linked to bar-related mechanisms such as the buckling instability (Athanassoula 2005; see also Di Matteo 2016; Fragkoudi et al. 2020, who compare observations with simulations). Thus, all evidence indicates that we live in a barred Galaxy with a secularly evolved, boxy-peanutshaped bulge (Kormendy & Kennicutt 2004). However, given the observational limitations that prevent us from studying these inner parts in detail (e.g. Surot et al. 2020), there is a great deal of uncertainty regarding the stellar populations inhabiting those areas.
To shed light on the properties of the inner Milky Way (MW) stars, a myriad of photometric and spectroscopic surveys have targeted this area, mainly focusing on the bulge (e.g. VVV/VVVX, Minniti et al. 2010; Saito et al. 2024; OGLE IV, Udalski et al. 2015; BRAVA, Rich et al. 2007; ARGOS, Freeman et al. 2013; GIBS, Zoccali et al. 2014; APOGEE, Majewski et al. 2017). The results from these works show that the inner Galaxy is much more complicated than previously thought. For instance, the prevailing view of the bulge being predominantly old is evolving as our understanding of the bulge stellar populations advances.
Early works that computed ages for the bulge stars suggest that it is eminently old, composed of stars older than 10 Gyr (e.g. Zoccali et al. 2003; Clarkson et al. 2011; Barbuy et al. 2018; Renzini et al. 2018; Bernard et al. 2018). However, other evidence indicates that, together with this old population, young and intermediate-age stars are also present (van Loon et al. 2003; Bensby et al. 2013; Catchpole et al. 2016; Bensby et al. 2017). Especially interesting is the discontinuous age distribution found by Bensby et al. (2017), who determined that more than 35% of the stars they analysed were younger than 8 Gyr; this suggests there were several episodes of star formation. On the other hand, Hasselquist et al. (2020), despite finding some evidence favouring the existence of an intermediate-age stellar population (2 to 5 Gyr, mainly metal-rich stars), still conclude that most of the bulge populations are older than 8 Gyr. Fortunately, there are strategies to circumvent the inherent difficulties of studying the inner Galaxy, by focusing on the solar neighbourhood.
Galaxies, including our own, are evolving entities, with stars moving across them. In fact, the mixture of stellar ages and metallicities observed in the solar vicinity (e.g. Carlberg et al. 1985; Edvardsson et al. 1993; Feltzing et al. 2001; Bergemann et al. 2014) can only be explained if stellar radial migration is taken into account (e.g. Sánchez-Blázquez et al. 2009; Schönrich & Binney 2009; Roškar et al. 2012; Pilkington et al. 2012; Halle et al. 2015). In particular, non-axisymmetric structures such as bars and spirals are natural re-distributors of angular momentum and, thus, of stars from and to the inner Galaxy (Minchev & Famaey 2010; Minchev et al. 2018; Haywood et al. 2024a). As a consequence of this radial migration, stars originally born in the inner Galaxy are now located in the solar vicinity (e.g. Hayden et al. 2015, 2018; Dantas et al. 2023; Nepal et al. 2024), where they can be studied in more detail thanks to their closeness. In particular, we can obtain photometric and spectroscopic data of main sequence and subgiant branch stars, which are key for age derivations. Therefore, the study of stars that migrated from the inner Galaxy to the solar neighbourhood opens a new window into the Galactic inner parts.
In this work, we applied colour-magnitude diagram (CMD) fitting to Gaia data (Gaia Collaboration 2016) to provide the age distribution of the most metal-rich stars in the solar vicinity. These stars were very likely born near the centre of the MW (e.g. Miglio et al. 2021) and, thus, offer an alternative avenue to study the stellar age distribution of the inner Galaxy. We qualitatively compared observational results with cosmological simulations from the Auriga Superstars suite1 (Grand et al. 2023; Pakmor et al. 2025, Fragkoudi et al., in prep.) to provide theoretical insights into our results. This paper is structured as follows. In Sect. 2 we describe the subset of stars from Gaia that we analysed in this work. Section 3 presents a brief overview of CMDft.Gaia, the methodology used to extract star formation histories (SFHs) from Gaia CMDs. Our main results and a discussion are provided in Sects. 4 and 5. Conclusions are outlined in Sect. 6.
2 Gaia data
Precise astrometry and photometry from the Gaia mission (Gaia Collaboration 2016, 2018, 2023b) is revolutionising our knowledge of the MW (e.g. Helmi et al. 2018; Belokurov et al. 2018; Cantat-Gaudin et al. 2018; Haywood et al. 2018). In particular, it allows for the derivation of age and metallicity distributions for large samples of stars from the analysis of CMDs in the absolute magnitude plane (Gallart et al. 2019; Ruiz-Lara et al. 2020; Gallart et al. 2024). In this particular work, we used stars that are located within a cylinder of 1 kpc of radius centred at the Sun and at a maximum distance2 of 3.5 kpc.
To construct the CMDs in the absolute plane corresponding to this set of stars, we needed to correct for the extinction from our own MW. For this, we used two different 3D extinction maps (Green et al. 2019; Lallement et al. 2022) to ensure that our results did not depend on this choice. We transformed reddening measurements to the Gaia photometric system using the recipes described in Fitzpatrick et al. (2019). Then, to compile a set of stars with the highest possible photometric quality, we applied a series of quality cuts. First, we kept only those stars whose extinction in the G band (AG) is below 0.5 magnitudes as largely extincted stars are likely to be affected by larger errors in the reddening determination, and thus, their position in the CMD is more uncertain.
Then, we identified and removed stars with unreliable photometry based on phot_bp_rp_excess_factor:

and

where bp_rp is the observed GBP-GRP colour.
In the same line of keeping only those stars with a position in the CMD as precise as possible, we only retained stars with parallax_over_error above 5 (i.e. ensuring a parallax relative uncertainty below 20%). Of all quality cuts, the most restrictive one is the one related to the reddening (AG above 0.5), affecting mainly the volumes located closer to the disc (up to 47% stars removed by this cut using the Lallement et al. 2022 dust map, slightly lower percentages using the Green et al. 2019 dust map). However, this effect drastically decreases with height; by height 0.3 kpc, fewer than 15% of the stars are removed because of this. Thus, the results presented in this paper are not affected by this completeness limitation. The rest of quality cuts reduces only by 2% (at most) the number of stars.
This sample of stars is then divided geometrically into layers according to their vertical distance to the Galactic plane (above and below). In this way, the maximum height of 3.5 kpc is divided into 16 volumes using the following limits:
![Mathematical equation: \pm z \rm \: bins = [0.0, 0.05, 0.1, 0.15, 0.2, 0.3, 0.4, 0.5, 0.6, 0.7, 0.8, 0.9, 1.0, 1.2, 1.6, 2.3, 3.5] \: \rm kpc.](/articles/aa/full_html/2026/01/aa56468-25/aa56468-25-eq3.png)
Volume 3 corresponds, for instance, to stars with heights (in absolute values3) from 0.1 to 0.15 kpc (i.e. above and below the plane). Together with this main Gaia dataset (basically information from the gaia_source catalogue), we also inspected the high-quality stellar chemo-physical parameters from the Gaia Data Release 3 (DR3) GSP-Spec catalogue (Gaia Collaboration 2023a, see our Sect. 5.3).
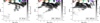 |
Fig. 1 Stellar density distribution in the age-metallicity plane for volumes 1, 5, and 8 (i.e. from the plane to 50 pc, 0.2-0.3 kpc, and 0.5-0.6 kpc, respectively, above and below the plane) as representative examples of the reported super-metal-rich populations (for these we used the Lallement et al. 2022 dust map). Coloured polygons delimit the areas in the age-metallicity plane used to quantify the z-profiles in Fig. 2. Note that a logarithmic scale has been used to represent the number of stars in order to enhance these relatively low-intensity features. |
3 Gaia colour-magnitude diagram fitting: CMDft.Gaia
This work is part of the ChronoGal project (Chronology of our Galaxy from Gaia CMD fitting; Gallart et al. 2024). Chrono-Gal is an ambitious project aiming at boosting our knowledge on how our Galaxy formed and evolved by providing one of the most sought combinations of parameters in Galactic Archaeology: precise stellar ages and metallicities. ChronoGal inherits the knowledge from decades of extracting SFHs of Local Group dwarf galaxies using CMD-fitting techniques4 (Gallart et al. 1999; Monelli et al. 2010a,b; Hidalgo et al. 2011; Gallart et al. 2015; Rusakov et al. 2021; Ruiz-Lara et al. 2021) to develop CMDft.Gaia. CMDft.Gaia is an updated set of tools that is in line with the philosophy of previous works (Aparicio & Gallart 2004; Aparicio & Hidalgo 2009; Bernard 2018; Ruiz-Lara et al. 2021) but tailored to Gaia data.
We used ChronoSynth to create a synthetic mother CMD composed of 120 million stars (MG brighter than 5) from the solar-scaled version of the BaSTI-IAC5 stellar evolution library (Hidalgo et al. 2018). Of the stars in the CMD, 30% were unresolved binaries (β), and we allowed for a minimum mass ratio for the binary members of 0.1 (qmin). This synthetic population was created assuming a Kroupa initial mass function (Kroupa et al. 1993); it covers ages from 0.02 to 13.5 Gyrs and global metallicities ([M∕H]) from −2.2 to 0.45. The populations in this mother synthetic CMD cannot be directly compared to any observed Gaia CMD. Thus, we simulated in it completeness and uncertainties using DisPar-Gaia (Ruiz-Lara et al. 2021, 2022; Fernández-Alvar et al. 2025). For this, together with the samples described in Sect. 2, we defined auxiliary samples after the geometric definition but before applying any quality cuts (full samples following the nomenclature introduced in Fernández-Alvar et al. 2025).
The comparison between observed and model CMDs (created as combinations of simple stellar populations, and including completeness and uncertainty effects) is done using dirSFH. Following the extensive testing carried out in Gallart et al. (2024), we applied a shift of −0.035 and 0.040 mag to the colour and magnitude of the synthetic stars, respectively, to account for residual shortcoming in the bolometric corrections adopted to transfer the stellar models from the theoretical plane to the Gaia photometric system. We also used a weighted scheme for the fit based on the inverse of the variance of the stellar ages in each CMD pixel and the ‘S’ bins6 (see Gallart et al. 2024, for more information).
4 Results
Figure 1 displays the derived distribution of stars in the age-metallicity plane for volumes 1, 5, and 8 using the Lallement et al. (2022) dust map. The stellar populations present in these age-metallicity distributions show a smooth variation from volume to volume. Despite this, we find a notable presence of supermetal-rich stars in the three exemplary volumes ([M/H]~0.3-0.45; 9.2, 6.4, and 2.8% for volumes 1, 5, and 8, respectively). Interestingly, rather than occupying the full age range, they pile up at particular stellar ages, namely ~13.5, 10, 7, 4, 2, and younger than 1 Gyr ;. Despite showing some spread in age and metallicity, partly a consequence of an age resolution effect, these results are compatible with the presence of narrow events of metal-rich star formation in the MW (see the discussion in Gallart et al. 2024). Also, we should highlight that the relative importance of these stellar populations slightly changes from volume to volume. Interestingly, starting from volume 8 (i.e. 0.5-0.6 kpc), these metal-rich populations progressively disappear (or the associated number of stars becomes so low that our method cannot detect them) towards higher z. First, population C disappears (volume 10, i.e. 0.7-0.8 kpc). Then, population B (volume 13, 1.0 to 1.2 kpc), followed by population D (volume 14, 1.2-1.6 kpc). By volume 15, 1.6 kpc and above, none of the populations are detected. Despite showing some spread in age and metallicity, partly a consequence of an age resolution effect, these enhancements are compatible with the presence of narrow events of metal-rich star formation in the MW (see the discussion in Gallart et al. 2024). In this work we focused on such metal-rich stars, leaving the rest of the results (all ages and metallicities) for a separate, in-depth paper dissecting the MW disc. Interestingly, as we hypothesise in Sect. 5.4, the ages of most of the stellar over-densities may coincide with the timing of several MW accretion events. As can be seen from that figure, the metallicity distribution for all these bursts has a sharp limit towards higher metallicities, mainly a consequence of the upper limit of the metallicity grid available in the models ([M/H]=0.45). Thus, we cannot rule out the possibility of having stars of a slightly higher metallicity than that. But, comparisons with spectroscopic metallicities (see Fernández-Alvar et al. 2025) suggest that the number of stars with a metallicity higher than our models’ upper limit should be very small.
Figure 2 characterises how the volume density of supermetal-rich stars changes as a function of |z| (height above and below the Galactic plane) for each of the identified events (different colours for different events and different lines for different dust maps). From this figure we can conclude that:
We find compatible results using different dust maps, especially in the case of the youngest events. Note the discrepancy for population E in the inner most region, probably linked with issues with the Bayestar dust map.
All events present a declining z profile, although each event declines differently. For instance, event E is the most prominent event until ~0.3 kpc, where events like C or D become more important.
Beyond 600 pc above and below the plane, the signature of these events nearly disappears (possibly due to the low number of stars and our methodology not being able to detect them).
Given the effects that the quality cuts described in Sect. 2 have on the completeness, especially in the inner parts, all these points should be considered as lower limits; the real profiles are likely be steeper.
The presence of a large amount of super-metal-rich stars in the solar neighbourhood is striking by itself. However, its peculiar distribution in stellar age is particularly noteworthy, hinting at the presence of enhanced events of star formation. The smooth variation with height shown in Fig. 2 and the agreement between different dust maps rule out the possibility that the finding of these super-metal-rich stars is simply the consequence of a deficient reddening correction7, although an unlikely mismatch between models and observations might be another option.
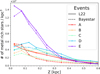 |
Fig. 2 Redshift profile of the number density of stars for the five different events of super-metal-rich star formation. Such events are defined using the polygons depicted in Fig. 1. We show the profiles using two different extinction maps, the Bayestar map (Green et al. 2019, dashed lines) and the Lallement et al. (2022) map (solid lines, L22). Given incompleteness affecting the observed samples together with quality cuts, absolute values for this number density should be taken with caution. A normalisation has been applied to the Bayestar densities to account for the missing quadrant in the Bayestar coverage (see Green et al. 2019). Colours have the same meanings as in Fig. 1. |
5 Discussion
In this work, we find clear evidence of the existence of a super-metal-rich stellar population in the solar neighbourhood displaying a peculiar (bursty) age distribution. We toyed with the possibility that these metal-rich stars were born in the inner regions of the MW and migrated outwards, probably on chaotic orbits due to the influence of the bar. This observational finding has the potential to provide crucial insights into the formation and evolution of our Galaxy’s inner parts. But, are these results consistent with the current knowledge? In this section we compare our results with the Auriga Superstars set of simulations as well as put together our observational results (Sect. 4) and previous works in the field to propose a feasible scenario on how our Galaxy’s inner parts built up.
5.1 Comparison with a cosmological simulation
To provide some physical insight into the possible origin of the super-metal-rich stars, we inspected the Auriga Superstars suite of cosmological simulations. These simulations are an improvement on the Auriga suite of 40 gravo-magnetohydrodynamic cosmological zoom-in simulations of the formation of MW-mass halos (Grand et al. 2017, 2024), run with the moving-mesh code AREPO. In this simulation, instead of forming just a single star particle per star-forming gas cell (as usual), superstars forms 64, and metals are injected only in the gas cell in which the star particle is located. For more information on the technicalities of these simulations and how they improve the former Auriga set, see Pakmor et al. (2017), Grand et al. (2017), Fragkoudi et al. (2021), Grand et al. (2023), Fragkoudi et al. (in prep.), and Pakmor et al. (in prep.).
Upon inspection of the Auriga Superstars simulations, we find that similar populations of super-metal-rich stars, with discontinuous age distribution, and somewhat disconnected from the main age-metallicity distribution, can be found in solar neighbourhood-like regions of barred galaxies. As an example, Fig. 3 shows the distribution of stars in the age-metallicity8 plane from a ‘solar neighbourhood’ of Auriga Superstars 18 (AuS18). AuS18 is a spiral galaxy that hosts a strong bar and a boxy-peanut bulge and can be considered a MW analogue (see Fragkoudi et al. 2020); it and also includes a Gaia-Enceladus-Sausagelike merging event (e.g. Fattahi et al. 2019; Merrow et al. 2024; Zhang et al. 2024). In this figure we colour-code the distribution of stars based on stellar density (left) and birth radius of the stars (right). We can find a population of super-metal-rich ([Fe/H] above 0.1) stars delineating a discontinuous sequence of ‘ups and downs’ in this plane separated from the bulk of the population. Also, based on information on their birth radius (right-hand panel), we can see that all these metal-rich stars (currently located in the solar neighbourhood) were born in the inner parts of AuS18 (the inner kiloparsec, mainly the bar, and the boxy-peanut shaped bulge) and migrated outwards. It is interesting to highlight here that, these bursts seem to be related to the pericentric passages of subhalo 6281 (pink squares), one of the most prominent mergers of AuS189. The onset of these ‘ups and downs’ coincides with the first pericentric passage of subhalo 6281 (~8 Gyr ago), and disappear right before the last approach. The physics behind this phenomenon will be discussed in a future, in-depth paper. The fact that, from all AuS simulated systems, these features only appear in galaxies hosting a bar, and especially the fact that stronger bars (as AuS18) display the clearest signs of them, seem to suggest that the bar plays an important role in shaping what we see (inducing radial migration, funnelling material to the centre and enabling metal-rich star formation, etc.).
The exact mechanisms shaping this population and forcing it to migrate to the solar neighbourhood are unknown and will be subject of study in a separate paper. However, we should note here that the escape of stars in chaotic orbits from the inner Galaxy to larger radii is a promising possibility to explain our findings; we expand on this more later (Romero-Gómez et al. 2006; Jung & Zotos 2016). For the purpose of the current work, it is relevant to mention that, from a theoretical point of view, it is expected to find metal-rich stars from the inner Galaxy as far out as the solar neighbourhood, especially in galaxies hosting a bar.
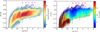 |
Fig. 3 Stellar age-metallicity distribution of stellar particles for a solar neighbourhood-like selection of stars from AuS18. The distribution of stars are colour-coded according to number density (left) and birth radius (right). Pericentric passages of subhalo 6281 are shown as pink squares. |
5.2 Metal-rich stars in the Milky Way and their existence in the solar vicinity
Stars of high metallicities such as those discussed in this work have been known to exist in the MW for a long time (e.g. Grenon 1972; Kordopatis et al. 2015; Miglio et al. 2021). In particular, the MW bulge is a complex superposition of stellar populations of very different metallicities (including super-metal-rich stars; see e.g. Zoccali et al. 2008; Ness & Freeman 2016; Zoccali et al. 2017; Nogueras-Lara 2022; Queiroz et al. 2021). However, these metal-rich stars are not only present in the innermost regions of the MW but also, in lower numbers, in the solar neighbourhood and along the Galactic plane (e.g. Trevisan et al. 2011). Whether these stars were born in the solar vicinity or not is not entirely known. Most evidence suggests that these stars are not formed locally, but have migrated from the inner parts (Halle et al. 2015; Hayden et al. 2015; Haywood et al. 2019; Khoperskov et al. 2020; Dantas et al. 2023; Nepal et al. 2024). To fully unveil their origin, a complete description of their properties, including dynamics, chemistry, and ages (to compare with our results), is needed.
Deriving stellar ages is an especially difficult task (Soderblom 2010). The most common method for obtaining age information in Galactic archaeology is through Bayesian isochrone-fitting methods (e.g. STARHORSE; Queiroz et al. 2023) using photometric, astrometric and spectroscopic data simultaneously to derive ages of individual stars. The addition of asteroseismology data constraining stellar masses can lead to an improvement in the age estimates (Ulrich 1986; Miglio et al. 2017; Bellinger et al. 2019). Nepal et al. (2024), using STARHORSE stellar ages, identified metal-rich stars as young as ~3 Gyr (bulk 6-11 Gyr) in the solar neighbourhood and used them to argue for a recent formation of the MW bar (see also Haywood et al. 2013; Miglio et al. 2021, for evidence of young metal-rich stars in the solar neighbourhood). Thus, the study presented here agrees with previous works on the existence of metal-rich stars with a wide age range in the solar neighbourhood. However, given that the consensus seems to indicate that these metal-rich stars migrated from the central parts, the real question we are tackling is actually related to the ages of the stars in the inner MW.
Zoccali et al. (2003), combining optical and near-IR stellar photometry, simultaneously quantified the metallicity distribution, age, and luminosity function of the Galactic bulge stellar population with no trace of any population younger than ~10 Gyr. But this is just the beginning of a myriad of works supporting for an eminently old bulge based mainly on Hubble Space Telescope deep CMDs. Clarkson et al. (2008) analysed the tightness of the oldest-main sequence turnoff stars in the SWEEPS field (Sahu et al. 2006) to conclude that the stellar populations in the bulge are ~11 Gyr old, and no younger than 8 Gyr old (although see Haywood et al. 2016, where the authors conclude that a wide range of stellar ages can also give a tight turnoff). In the same line, Renzini et al. (2018), analysing both CMDs and luminosity functions, set an upper limit on the amount of young stars in the bulge, featuring an insignificant population of stars younger than ~5 Gyr. However, the careful spectroscopic analysis by Bensby et al. (2013, 2017), more successful at breaking the age-metallicity degeneracy, suggested the presence of stars of almost all ages in the bulge. In particular, the authors found signs of a bursty behaviour, with episodes of enhanced star formation 3, 6, 8, and 11 Gyr ago. In addition, evidence exists suggesting that the nuclear stellar disc experienced a sudden burst of star formation in the last gigayear (Nogueras-Lara et al. 2020). From the theoretical side, numerical simulations of barred, disc galaxies also find that the star formation in the bars can proceed in a bursty way, due to feedback or triggered by interactions and satellite flybys (e.g. Seo et al. 2019; Li et al. 2024). Moreover, several works have claimed that the MW bulge stellar population is in fact a mixture of thin and thick disc stars highly influenced and trapped by the dynamics of the bar (e.g. Di Matteo 2016; Fragkoudi et al. 2017; Debattista et al. 2017). For a recent, comprehensive review on what is known about the MW bulge, see Zoccali & Valenti (2024). All these works, theoretical and observational, support the existence of a patchy stellar age distribution for the bulge stars, in agreement with our findings if we assume that the super-metal-rich stars in the solar neighbourhood formed in the inner MW and migrated outwards.
5.3 The Gaia GSP-Spec perspective
Recio-Blanco et al. (2024), using a selection of high-quality stellar chemophysical parameters from the Gaia DR3 GSP-Spec (The General Stellar Parametrizer-spectroscopy) catalogue (Gaia Collaboration 2023a), also reported the presence of super-metalrich stars in a wide age range in the solar neighbourhood. In addition, they clearly observe two populations of giant stars in the Kiel diagram (log(g) vs Teff; see their Figs. 8 and 11), which they associate with the thin versus thick disc bimodality (a complete discussion on MW thin vs thick discs can be found in Kawata & Chiappini 2016). After comparing with BaSTI isochrones, they demonstrate that an age gap is needed to explain the separation of the two evolutionary sequences as well as the distribution of stars near the main sequence turnoff. To put our results in the context of their analysis, and to see if their reported age gap is consistent with the distinct episodes of star formation inferred from our derived age-metallicity distribution, Fig. 4 reproduces their figure 6 and expands on it.
Figure 4 shows a Kiel diagram of the sample of stars within our volume analysed in Recio-Blanco et al. (2024) with metallicities10 in the range [Fe/H] = 0.3-0.5. We overplot some BaSTI isochrones coinciding with our main detected metal-rich populations (13.5, 10, 7, 4, 2, 1, and 0.6 Gyr). By matching the position of the stars with these isochrones, we can confirm the presence of metal-rich stars of ages even younger than ~2 Gyr old (in agreement with our stellar age distribution). The righthand panel in Fig. 4 (zooming into the main sequence turnoff region) highlights how well all the old and intermediate age isochrones (13.5, 10.0, 7, and 4 Gyr) match the main sequence turnoff and subgiant branch. Thus, this plot confirms our findings on one of the highest-quality sets of stellar astrophysical parameters to date. Not only are there metal-rich stars in the solar neighbourhood, but they also exhibit a wide range of ages and a noticeable discretisation (not stars of all ages) that is consistent with our episodic stellar age distribution. Nevertheless, we need to add that, although this comparison validates our results, a study such as that presented in this paper is necessary to achieve the age resolution required (Gallart et al. 2024) to fully characterise the age distribution of metal-rich stars in the solar neighbourhood. It also enables us to quantify the relative importance of each population: note that this particular spectroscopic sample has strong selection effects derived from the requirement of highly accurate measurements of the stellar parameters.
To further assess the origin of the metal-rich stars currently observed in the solar vicinity, we compared the orbital properties (vφ, guiding radius, and eccentricity)11 for metal-rich stars and a similar number of solar-metallicity stars12 from Recio-Blanco et al. (2024); see Fig. 5. From the figure (left panel), we can identify two distinct families of metal-rich stars. On the one hand, there are some stars that present lower values of |vφ|, smaller guiding radii, and larger eccentricity (purple in Figs. 4 and 5) with respect to the overall solar-metallicity population. We call these metal-rich stars ‘slow stars’. On the other hand, we also have stars with very similar orbital properties as the solar-metallicity stars in the solar neighbourhood (in orange in Fig. 4 and in the middle and right-hand panels of Fig. 5). We call these metal-rich stars ‘fast stars’. As we will see, these two behaviours are consistent with different radial migration mechanisms.
Schönrich & Binney (2009) proposed the existence of two different drivers for radial migration, namely churning (change in angular momentum manifested as a change in guiding radius, also known as diffusion) and blurring or radial heating (a change in the epicyclic amplitude leading to epicyclic excursions). Thus, fast stars, sharing orbital properties with the bulk of the population near the Sun, might be examples of stars that migrated from the inner regions via churning, and thus, share orbital properties with stars born in the solar vicinity. On the other hand, slow stars might be in their apocentres (explaining the low value of |vφ|), just experiencing an epicyclic immersion to the outer parts of their orbits (high eccentricity and smaller guiding radius). All this is consistent with super-metal-rich stars being present at the solar radius via both migration mechanisms, blurring and churning. Interestingly, while fast stars are around 2.5 times more abundant than slow stars overall, in the temperature range from 7000 to 8000 K (see Fig. 4, which is dominated by stars younger than 1 Gyr), the ratio is ~11, highlighting a near absence of young, slow stars migrated via blurring. This can be seen as young metal-rich stars being present in the solar neighbourhood preferentially via churning, which could be interpreted as churning being more efficient than blurring in terms of radial distance migrated per gigayear (i.e. young stars migrating due to blurring did not have time to get to the solar radius). This would be in agreement with Frankel et al. (2020), who concluded, using APOGEE data, that radial migration in the MW disc is dominated by diffusion in angular momentum, i.e. churning. However, a migration speed of the order of a solar radius per gigayear is probably unfeasible (see e.g. Lian et al. 2022), and thus, we have to leave the door open to the possibility that very young, metal-rich stars are really born in situ.
After all the discussion so far, it is reasonable to think that the discontinuous age distribution that we find for metal-rich stars in the solar neighbourhood could be mirroring the age distribution of stars in the innermost regions of our Galaxy. It is now the moment to put all these pieces together to form a comprehensive, evolutionary picture.
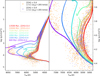 |
Fig. 4 Kiel diagram of the disc super-metal-rich population with [M/H]=0.4±0.1 dex. We divide the sample in two based on their value of vφ: slow (purple) and fast (orange) stars (see Fig. 5). Solar-scaled BaSTI isochrones of 13.5, 10, 7, 4, 2, 1, and 0.6 Gyr (red, orange, teal, green, cyan, blue, and purple, respectively) are overlaid on the data. Left : whole diagram. Right : turnoff region only. |
5.4 Reconstructing the past of the MW inner regions
The discretisation in stellar age displayed by metal-rich stars unveiled in this work reflects on possible bursts of star formation ~13.5, 10, 7, 4, and less than 2 Gyr ago. Among the many mechanisms that could trigger the formation of new stars, merger events and interaction with satellites stand out (Mihos & Hernquist 1994; Hernquist & Mihos 1995; Di Cintio et al. 2021; Renaud et al. 2021b,a; Orkney et al. 2022). In particular, in the case of barred galaxies, as the bar could act as a conveyor belt driving gas through the bar to the inner region (e.g. Fragkoudi et al. 2016; Pérez et al. 2017; Seo et al. 2019), these newly born stars could be formed from gas compressed in the centre by tidal forces from the satellite passages. Putting together this and our current knowledge on the MW accretion history, a plausible, yet speculative, scenario on the past of the MW inner regions appears.
The MW would initially form stars rapidly, resulting in the formation of the oldest stars in our Galaxy, with ages ~13.5 Gyr. The intensity of the star formation at that time would result in the formation of very metal-rich stars early in the history of the Universe (e.g. Trevisan et al. 2011). After this, many small accretion events should have taken place (e.g. Helmi 2020), with Gaia -Sausage-Enceladus (merging around 10-9 Gyr ago; Gallart et al. 2019; Di Matteo et al. 2019; Montalbán et al. 2021) being the latest major accretion event experienced by the MW (Belokurov et al. 2018; Helmi et al. 2018; Ciucă et al. 2024), and possibly triggering the formation of the bar (Merrow et al. 2024). It was not until ~7-6 Gyr ago that the Sagittarius dwarf galaxy (Sgr; Ibata et al. 1994) experienced its first pericentric passage about the MW (Law & Majewski 2010; Ruiz-Lara et al. 2020), recurrently undergoing pericentric passages and affecting the dynamics of the MW from then on (Gómez et al. 2013; Laporte et al. 2019; Antoja et al. 2020). Finally, during the last 2 Gyr or so the MW should have experienced the combined effect of Sgr and the Magellanic system infall (Besla et al. 2007; Laporte et al. 2018; Patel et al. 2020; Vasiliev et al. 2021). As the reader may notice, the correlation between the timing of the expected episodes of interaction between the MW and its satellite system and our tentative star formation bursts (~13.5, 10, 7, 4, and less than 2 Gyr ago) is striking.
Note that these star formation enhancements linked to interactions should not be restricted to the metal-rich stars or concentrated only on the inner Galaxy. They could be global across the whole MW. From Fig. 6, where we represent the stellar age distribution for stars with [M/H] above and below 0.3 (red and blue, respectively for all volumes within 0.6 kpc from the plane of the disc), it can be noticed that these epochs coincide with the presence of stars and peaks in its numbers at lower metal-licities as well. Interestingly, all peaks in the stellar ages of the metal-rich stars seem to be slightly shifted towards younger ages. This might be a consequence of a delay in the star formation from the outer disc to the inner Galaxy. Given that the star formation enhancements are not restricted to the metal-rich end, we can conclude that we are indeed witnessing global star formation enhancements in the MW rather than central ones.
Therefore, all these external events seem to have accelerated star formation in the whole MW, including its central parts (Mihos & Hernquist 1994; Hernquist & Mihos 1995), which would have led to a fast chemical enrichment, especially in the inner Galaxy. In the case of barred galaxies like our MW (as shown by the comparison with the Auriga Superstars simulations), some mechanisms (probably bar-(spiral)-induced radial redistribution) could move inner stars (of any metallicity) to the solar neighbourhood (e.g. Minchev & Famaey 2010; Iles et al. 2024), with those displaying the highest metallicities standing out due to the lack of in situ, metal-rich stars in these outer regions. However, there is one difficulty with this scenario. Stars born in the inner parts, in order to get to the solar vicinity, need to pass co-rotation, which, dynamically speaking, is not preferred (Ceverino & Klypin 2007; Halle et al. 2015). Nevertheless, it has been shown numerically that the bar should affect the kinematics of stars in the solar neighbourhood (Brunetti et al. 2011; Haywood et al. 2024b). Also, although only to a limited number, stars in chaotic orbits can cross co-rotation and get to the solar neighbourhood (see Fig. 3 but also Raboud et al. 1998; Fux 2001). In particular, the manifold theory of spiral structure (Romero-Gómez et al. 2006; Voglis et al. 2006) provides a dynamical mechanisms on how chaotic motions can significantly change the spatial distribution of matter up to the outer regions. Other mechanisms have been claimed to allow inner stars to migrate to the solar neighbourhood such as overlap between bar and spiral arm resonances (e.g. Minchev & Famaey 2010) or bar slowdown (Chiba et al. 2021). Okalidis et al. (2022), analysing Auriga simulations, found that strongly barred galaxies show larger stellar migration, though with a longer timescale than diffusion (churning). However, the authors find stars with a net radial migration over time that can reach a maximum ∆R of ~5 kpc, with rates that can be as high as 25 kpc/Gyr. Thus, as shown in the case of the Auriga Superstars simulations commented in Sect. 5.1, we can reasonably expect to find metal-rich stars from the inner Galaxy (∼3 kpc) in the solar neighbourhood, despite the possible co-rotation barrier as soon as 1 Gyr after its formation.
In this work we hypothesise that we might be indirectly witnessing how star formation proceeded in the central regions of the MW from the age distribution of metal-rich stars in the solar neighbourhood. These stars are expected to have migrated here via both churning and blurring. However, there are still a couple of aspects to be addressed, namely (i) the absence of metal-rich stars with ages between 6.5 and 4.5 Gyr ago while a peak of star formation at the solar radius is observed and (ii) the origin of the particularly narrow 4 Gyr old population. The former suggests a period of decreased or null star formation in the central MW (see Nogueras-Lara et al. 2020, for quiescent periods of star formation in the MW nuclear disc); this may have been caused by the first pericentric passage of Sgr mainly triggering star formation in the mid to outer parts of the Galaxy. This interpretation is in line with what was found in Renaud et al. (2021a,b) using the Vintergatan simulation (Agertz et al. 2021). Further supporting this idea is the presence of a very metal-poor population ([M/H]—0.9 dex, not found at any other ages) at an age roughly coinciding with event C.
Regarding the event D enhancement, to our knowledge no merging events are suspected in the MW at this age. However, this population is so clearly detected that it forces us to think that something quite dramatic might have happened 4 Gyr ago in the history of our Galaxy to form such a feature. However, the census of MW merging events is far from complete, especially considering the possibility of satellites in orbits near the plane of the Galaxy, whose tidal streams are more difficult to detect (as in the case of the Icarus stellar stream; Re Fiorentin et al. 2021). Also, the possible orbit of Sgr after its merger, as far back as 4 Gyr is still uncertain (Vasiliev et al. 2021). Interestingly, the 4 Gyr enhancement coincides with what Nepal et al. (2024) suggest to be a period of increased star formation due to a high bar activity period and linked to its formation. However, although our findings do not rule out bar formation ~3-4 Gyr ago, they also agree with a formation 10 Gyr ago, probably linked to the interaction with Gaia-Enceladus-Sausage (Bovy et al. 2019; Merrow et al. 2024; Sanders et al. 2024). Also, putting this event within the context of the full reconstructed SFH, we see that it is directly followed by a period of low star formation at lower metallici-ties (in the solar neighbourhood), after which we find another intense period (see Fig. 1, labelled E; see also Fig. 6). This could be related to a second pericentric passage of Sgr or the accretion of a gaseous intergalactic filament associated with the accretion of Sgr (in the line of what is described in Renaud et al. 2021b). Whatever might have happened to the MW 4 Gyr ago clearly deserves further investigation beyond the scope of this paper.
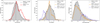 |
Fig. 5 Orbital properties of the metal-rich stars detected in the high-quality Gaia DR3 GSP-Spec sub-catalogue from Recio-Blanco et al. (2024), compared with those of a subset of solar-metallicity stars. Left : distribution of vφ velocities for metal-rich (red, empty histogram) and solar-metallicity (grey histogram) stars. From the shape of the metal-rich stars histogram we divide the sample into slow (|vφ| below 205 km/s) and fast (|vφ| above 205 km/s) stars. Middle : distribution of guiding radius (from Recio-Blanco et al. 2024). Right : distribution of eccentricity (from Recio-Blanco et al. 2024). For these last panels, we divide the sample into solar metallicity (grey), slow, metal-rich stars (purple) and fast, metal-rich stars (orange). |
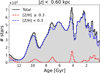 |
Fig. 6 Integrated stellar age distribution of the stars within 0.6 kpc of the plane of the disc (|z|<0.6 kpc). We show all the stars (shaded black area), the metal-rich stars ([M/H] ≥ 0.3, red), and the remaining stars ([M/H] < 0.3, blue). |
6 Conclusions
Using CMDft.Gaia, a CMD-fitting technique tailored to Gaia data, we have identified a discrete age distribution for the metalrich stars present in the solar neighbourhood. By combining these findings with the analysis of Auriga Superstars simulations, ultra-precise stellar chemo-physical parameters (Recio-Blanco et al. 2023), and literature results, we pieced together a comprehensive, albeit speculative, scenario to be confirmed by upcoming theoretical works. As these metal-rich stars likely did not form in the solar vicinity, we used them as tracers of the stellar age distribution present in the inner parts of our Galaxy. The discretisation of the stellar age distribution might be a consequence of global star formation proceeding episodically, driven by external events (early accretion, Gaia-Sausage-Enceladus, Sgr, and Magellanic Clouds). In this scenario, bar-induced radial migration would be responsible for the presence of these metal-rich stars at solar radii, with their relative scarcity due to the fact that passing co-rotation is difficult, but feasible, in dynamical terms.
This work perfectly exemplifies the power of CMD reconstruction techniques to both answer and pose questions about the formation and evolution of our Galaxy. The high-quality and high-resolution age-metallicity distributions that the ChronoGal project is providing and will provide are set to be a milestone in the field.
Acknowledgements
We are thankful to the anonymous reviewer for improving the quality of the original manuscript. The authors are grateful to C. Chiappini, D. Kawata, A. Recio-Blanco, and M. Zoccali for useful conversations. We acknowledge financial support by the research projects PID2020-113689GB-I00, PID2020-114414GB-I00, and PID2023-150319NB-C21 financed by MCIN/AEI/10.13039/501100011033, the project A-FQM-510-UGR20 financed from FEDER/Junta de Andalucía-Consejería de Transformación Económica, Industria, Conocimiento y Universidades/Proyecto and by the grants P20-00334 and FQM108, financed by the Junta de Andalucía (Spain). TRL acknowledges support from Juan de la Cierva fellowship (IJC2020-043742-I) and Ramón y Cajal fellowship (RYC2023-043063-I, financed by MCIU/AEI/10.13039/501100011033 and by the FSE+). FvdV is supported by a Royal Society University Research Fellowship (URF\R1\191703 and URF\R\241005). EFA acknowledges support from HORIZON TMA MSCA Postdoctoral Fellowships Project TEMPOS, number 101066193, call HORIZON-MSCA-2021-PF-01, by the European Research Executive Agency ABQa acknowledges support from Juan de la Cierva fellowship (PLease add reference). SC acknowledges financial support from PRIN-MIUR-22: CHRONOS: adjusting the clock(s) to unveil the CHRONO-chemo-dynamical Structure of the Galaxy” (PI: S. Cassisi) funded by the European Union - Next Generation EU, Theory grant INAF 2023 (PI: S. Cassisi), and the Large Grant INAF 2023 MOVIE (PI: M. Marconi). RG is supported by an STFC Ernest Rutherford Fellowship (ST/W003643/1). RB is supported by the SNSF through the Ambizione Grant PZ00P2_223532. FAG acknowledges support from the ANID BASAL project FB210003, from the ANID FONDECYT Regular grants 1251493, and the HORIZON-MSCA-2021-SE-01 Research and Innovation Programme under the Marie Sklodowska-Curie grant agreement number 101086388.
References
- Agertz, O., Renaud, F., Feltzing, S., et al. 2021, MNRAS, 503, 5826 [NASA ADS] [CrossRef] [Google Scholar]
- Anders, F., Khalatyan, A., Chiappini, C., et al. 2019, A&A, 628, A94 [NASA ADS] [CrossRef] [EDP Sciences] [Google Scholar]
- Antoja, T., Ramos, P., Mateu, C., et al. 2020, A&A, 635, L3 [NASA ADS] [CrossRef] [EDP Sciences] [Google Scholar]
- Aparicio, A., & Gallart, C. 2004, AJ, 128, 1465 [NASA ADS] [CrossRef] [Google Scholar]
- Aparicio, A., & Hidalgo, S. L. 2009, AJ, 138, 558 [NASA ADS] [CrossRef] [Google Scholar]
- Athanassoula, E. 2005, MNRAS, 358, 1477 [NASA ADS] [CrossRef] [Google Scholar]
- Bailer-Jones, C. A. L., Rybizki, J., Fouesneau, M., Mantelet, G., & Andrae, R. 2018, AJ, 156, 58 [Google Scholar]
- Barbuy, B., Chiappini, C., & Gerhard, O. 2018, ARA&A, 56, 223 [Google Scholar]
- Bellinger, E. P., Hekker, S., Angelou, G. C., Stokholm, A., & Basu, S. 2019, A&A, 622, A130 [NASA ADS] [CrossRef] [EDP Sciences] [Google Scholar]
- Belokurov, V., Erkal, D., Evans, N. W., Koposov, S. E., & Deason, A. J. 2018, MNRAS, 478, 611 [Google Scholar]
- Bensby, T., Yee, J. C., Feltzing, S., et al. 2013, A&A, 549, A147 [NASA ADS] [CrossRef] [EDP Sciences] [Google Scholar]
- Bensby, T., Feltzing, S., Gould, A., et al. 2017, A&A, 605, A89 [NASA ADS] [CrossRef] [EDP Sciences] [Google Scholar]
- Bergemann, M., Ruchti, G. R., Serenelli, A., et al. 2014, A&A, 565, A89 [NASA ADS] [CrossRef] [EDP Sciences] [Google Scholar]
- Bernard, E. J. 2018, in IAU Symposium, 334, Rediscovering Our Galaxy, eds. C. Chiappini, I. Minchev, E. Starkenburg, & M. Valentini, 158 [Google Scholar]
- Bernard, E. J., Schultheis, M., Di Matteo, P., et al. 2018, MNRAS, 477, 3507 [CrossRef] [Google Scholar]
- Besla, G., Kallivayalil, N., Hernquist, L., et al. 2007, ApJ, 668, 949 [Google Scholar]
- Bovy, J., Leung, H. W., Hunt, J. A. S., et al. 2019, MNRAS, 490, 4740 [Google Scholar]
- Brunetti, M., Chiappini, C., & Pfenniger, D. 2011, A&A, 534, A75 [NASA ADS] [CrossRef] [EDP Sciences] [Google Scholar]
- Cantat-Gaudin, T., Jordi, C., Vallenari, A., et al. 2018, A&A, 618, A93 [NASA ADS] [CrossRef] [EDP Sciences] [Google Scholar]
- Carlberg, R. G., Dawson, P. C., Hsu, T., & Vandenberg, D. A. 1985, ApJ, 294, 674 [NASA ADS] [CrossRef] [Google Scholar]
- Catchpole, R. M., Whitelock, P. A., Feast, M. W., et al. 2016, MNRAS, 455, 2216 [NASA ADS] [CrossRef] [Google Scholar]
- Ceverino, D., & Klypin, A. 2007, MNRAS, 379, 1155 [NASA ADS] [CrossRef] [Google Scholar]
- Chiba, R., Friske, J. K. S., & Schönrich, R. 2021, MNRAS, 500, 4710 [Google Scholar]
- Ciucă, I., Kawata, D., Ting, Y.-S., et al. 2024, MNRAS, 528, L122 [Google Scholar]
- Clarkson, W., Sahu, K., Anderson, J., et al. 2008, ApJ, 684, 1110 [NASA ADS] [CrossRef] [Google Scholar]
- Clarkson, W. I., Sahu, K. C., Anderson, J., et al. 2011, ApJ, 735, 37 [NASA ADS] [CrossRef] [Google Scholar]
- Dantas, M. L. L., Smiljanic, R., Boesso, R., et al. 2023, A&A, 669, A96 [NASA ADS] [CrossRef] [EDP Sciences] [Google Scholar]
- Debattista, V. P., Ness, M., Gonzalez, O. A., et al. 2017, MNRAS, 469, 1587 [Google Scholar]
- Di Cintio, A., Mostoghiu, R., Knebe, A., & Navarro, J. F. 2021, MNRAS, 506, 531 [NASA ADS] [CrossRef] [Google Scholar]
- Di Matteo, P. 2016, PASA, 33, e027 [CrossRef] [Google Scholar]
- Di Matteo, P., Haywood, M., Lehnert, M. D., et al. 2019, A&A, 632, A4 [NASA ADS] [CrossRef] [EDP Sciences] [Google Scholar]
- Dwek, E., Arendt, R. G., Hauser, M. G., et al. 1995, ApJ, 445, 716 [CrossRef] [Google Scholar]
- Edvardsson, B., Andersen, J., Gustafsson, B., et al. 1993, A&AS, 102, 603 [NASA ADS] [Google Scholar]
- Fattahi, A., Belokurov, V., Deason, A. J., et al. 2019, MNRAS, 484, 4471 [NASA ADS] [CrossRef] [Google Scholar]
- Feltzing, S., Holmberg, J., & Hurley, J. R. 2001, A&A, 377, 911 [NASA ADS] [CrossRef] [EDP Sciences] [Google Scholar]
- Fernández-Alvar, E., Ruiz-Lara, T., Gallart, C., et al. 2025, A&A, 704, A258 [NASA ADS] [CrossRef] [EDP Sciences] [Google Scholar]
- Fitzpatrick, E. L., Massa, D., Gordon, K. D., Bohlin, R., & Clayton, G. C. 2019, ApJ, 886, 108 [Google Scholar]
- Fragkoudi, F., Athanassoula, E., & Bosma, A. 2016, MNRAS, 462, L41 [NASA ADS] [CrossRef] [Google Scholar]
- Fragkoudi, F., Di Matteo, P., Haywood, M., et al. 2017, A&A, 606, A47 [NASA ADS] [CrossRef] [EDP Sciences] [Google Scholar]
- Fragkoudi, F., Grand, R. J. J., Pakmor, R., et al. 2020, MNRAS, 494, 5936 [Google Scholar]
- Fragkoudi, F., Grand, R. J. J., Pakmor, R., et al. 2021, A&A, 650, L16 [NASA ADS] [CrossRef] [EDP Sciences] [Google Scholar]
- Frankel, N., Sanders, J., Ting, Y.-S., & Rix, H.-W. 2020, ApJ, 896, 15 [NASA ADS] [CrossRef] [Google Scholar]
- Freeman, K., Ness, M., Wylie-de-Boer, E., et al. 2013, MNRAS, 428, 3660 [NASA ADS] [CrossRef] [Google Scholar]
- Fux, R. 2001, A&A, 373, 511 [NASA ADS] [CrossRef] [EDP Sciences] [Google Scholar]
- Gaia Collaboration (Prusti, T., et al.) 2016, A&A, 595, A1 [NASA ADS] [CrossRef] [EDP Sciences] [Google Scholar]
- Gaia Collaboration (Brown, A. G. A., et al.) 2018, A&A, 616, A1 [NASA ADS] [CrossRef] [EDP Sciences] [Google Scholar]
- Gaia Collaboration (Recio-Blanco, A., et al.) 2023a, A&A, 674, A38 [CrossRef] [EDP Sciences] [Google Scholar]
- Gaia Collaboration (Vallenari, A., et al.) 2023b, A&A, 674, A1 [NASA ADS] [CrossRef] [EDP Sciences] [Google Scholar]
- Gallart, C., Monelli, M., Mayer, L., et al. 2015, ApJ, 811, L18 [NASA ADS] [CrossRef] [Google Scholar]
- Gallart, C., Freedman, W. L., Aparicio, A., Bertelli, G., & Chiosi, C. 1999, AJ, 118, 2245 [NASA ADS] [CrossRef] [Google Scholar]
- Gallart, C., Bernard, E. J., Brook, C. B., et al. 2019, Nat. Astron., 3, 932 [NASA ADS] [CrossRef] [Google Scholar]
- Gallart, C., Surot, F., Cassisi, S., et al. 2024, A&A, 687, A168 [NASA ADS] [CrossRef] [EDP Sciences] [Google Scholar]
- Gargiulo, I. D., Monachesi, A., Gómez, F. A., et al. 2019, MNRAS, 489, 5742 [Google Scholar]
- Gómez, F. A., Minchev, I., O’Shea, B. W., et al. 2013, MNRAS, 429, 159 [Google Scholar]
- Grand, R. J. J., Gómez, F. A., Marinacci, F., et al. 2017, MNRAS, 467, 179 [NASA ADS] [Google Scholar]
- Grand, R. J. J., Kawata, D., Belokurov, V., et al. 2020, MNRAS, 497, 1603 [NASA ADS] [CrossRef] [Google Scholar]
- Grand, R. J. J., Pakmor, R., Fragkoudi, F., et al. 2023, MNRAS, 524, 801 [NASA ADS] [CrossRef] [Google Scholar]
- Grand, R. J. J., Fragkoudi, F., Gómez, F. A., et al. 2024, MNRAS, 532, 1814 [NASA ADS] [CrossRef] [Google Scholar]
- Green, G. M., Schlafly, E., Zucker, C., Speagle, J. S., & Finkbeiner, D. 2019, ApJ, 887, 93 [NASA ADS] [CrossRef] [Google Scholar]
- Grenon, M. 1972, in IAU Colloq. 17: Age des Etoiles, eds. G. Cayrel de Strobel, & A. M. Delplace, 55 [Google Scholar]
- Halle, A., Di Matteo, P., Haywood, M., & Combes, F. 2015, A&A, 578, A58 [NASA ADS] [CrossRef] [EDP Sciences] [Google Scholar]
- Hasselquist, S., Zasowski, G., Feuillet, D. K., et al. 2020, ApJ, 901, 109 [CrossRef] [Google Scholar]
- Hayden, M. R., Bovy, J., Holtzman, J. A., et al. 2015, ApJ, 808, 132 [Google Scholar]
- Hayden, M. R., Recio-Blanco, A., de Laverny, P., et al. 2018, A&A, 609, A79 [NASA ADS] [CrossRef] [EDP Sciences] [Google Scholar]
- Haywood, M., Di Matteo, P., Lehnert, M. D., Katz, D., & Gómez, A. 2013, A&A, 560, A109 [NASA ADS] [CrossRef] [EDP Sciences] [Google Scholar]
- Haywood, M., Di Matteo, P., Snaith, O., & Calamida, A. 2016, A&A, 593, A82 [NASA ADS] [CrossRef] [EDP Sciences] [Google Scholar]
- Haywood, M., Di Matteo, P., Lehnert, M. D., et al. 2018, ApJ, 863, 113 [Google Scholar]
- Haywood, M., Snaith, O., Lehnert, M. D., Di Matteo, P., & Khoperskov, S. 2019, A&A, 625, A105 [NASA ADS] [CrossRef] [EDP Sciences] [Google Scholar]
- Haywood, M., Khoperskov, S., Cerqui, V., et al. 2024a, A&A, 690, A147 [NASA ADS] [CrossRef] [EDP Sciences] [Google Scholar]
- Haywood, M., Khoperskov, S., Cerqui, V., et al. 2024b, A&A, 690, A147 [NASA ADS] [CrossRef] [EDP Sciences] [Google Scholar]
- Helmi, A. 2020, ARA&A, 58, 205 [Google Scholar]
- Helmi, A., Babusiaux, C., Koppelman, H. H., et al. 2018, Nature, 563, 85 [Google Scholar]
- Hernquist, L., & Mihos, J. C. 1995, ApJ, 448, 41 [NASA ADS] [CrossRef] [Google Scholar]
- Hidalgo, S. L., Aparicio, A., Skillman, E., et al. 2011, ApJ, 730, 14 [Google Scholar]
- Hidalgo, S. L., Pietrinferni, A., Cassisi, S., et al. 2018, ApJ, 856, 125 [Google Scholar]
- Howard, C. D., Rich, R. M., Clarkson, W., et al. 2009, ApJ, 702, L153 [NASA ADS] [CrossRef] [Google Scholar]
- Ibata, R. A., Gilmore, G., & Irwin, M. J. 1994, Nature, 370, 194 [Google Scholar]
- Iles, E. J., Pettitt, A. R., Okamoto, T., & Kawata, D. 2024, MNRAS, 527, 2799 [Google Scholar]
- Jung, C., & Zotos, E. E. 2016, MNRAS, 457, 2583 [Google Scholar]
- Kawata, D., & Chiappini, C. 2016, Astron. Nachr., 337, 976 [CrossRef] [Google Scholar]
- Khoperskov, S., Di Matteo, P., Haywood, M., Gómez, A., & Snaith, O. N. 2020, A&A, 638, A144 [NASA ADS] [CrossRef] [EDP Sciences] [Google Scholar]
- Kordopatis, G., Binney, J., Gilmore, G., et al. 2015, MNRAS, 447, 3526 [Google Scholar]
- Kormendy, J., & Kennicutt, Robert C. J. 2004, ARA&A, 42, 603 [Google Scholar]
- Kroupa, P., Tout, C. A., & Gilmore, G. 1993, MNRAS, 262, 545 [NASA ADS] [CrossRef] [Google Scholar]
- Lallement, R., Vergely, J. L., Babusiaux, C., & Cox, N. L. J. 2022, A&A, 661, A147 [NASA ADS] [CrossRef] [EDP Sciences] [Google Scholar]
- Laporte, C. F. P., Johnston, K. V., Gómez, F. A., Garavito-Camargo, N., & Besla, G. 2018, MNRAS, 481, 286 [Google Scholar]
- Laporte, C. F. P., Minchev, I., Johnston, K. V., & Gómez, F. A. 2019, MNRAS, 485, 3134 [Google Scholar]
- Law, D. R., & Majewski, S. R. 2010, ApJ, 714, 229 [Google Scholar]
- Li, X., Shlosman, I., Pfenniger, D., & Heller, C. 2024, ApJ, 971, L36 [NASA ADS] [CrossRef] [Google Scholar]
- Lian, J., Zasowski, G., Hasselquist, S., et al. 2022, MNRAS, 511, 5639 [NASA ADS] [CrossRef] [Google Scholar]
- Lindegren, L., Bastian, U., Biermann, M., et al. 2021, A&A, 649, A4 [EDP Sciences] [Google Scholar]
- Luri, X., Brown, A. G. A., Sarro, L. M., et al. 2018, A&A, 616, A9 [NASA ADS] [CrossRef] [EDP Sciences] [Google Scholar]
- Majewski, S. R., Schiavon, R. P., Frinchaboy, P. M., et al. 2017, AJ, 154, 94 [NASA ADS] [CrossRef] [Google Scholar]
- McWilliam, A., & Zoccali, M. 2010, ApJ, 724, 1491 [NASA ADS] [CrossRef] [Google Scholar]
- Merrow, A., Grand, R. J. J., Fragkoudi, F., & Martig, M. 2024, MNRAS, 531, 1520 [CrossRef] [Google Scholar]
- Miglio, A., Chiappini, C., Mosser, B., et al. 2017, Astron. Nachr., 338, 644 [Google Scholar]
- Miglio, A., Chiappini, C., Mackereth, J. T., et al. 2021, A&A, 645, A85 [NASA ADS] [CrossRef] [EDP Sciences] [Google Scholar]
- Mihos, J. C., & Hernquist, L. 1994, ApJ, 425, L13 [Google Scholar]
- Minchev, I., & Famaey, B. 2010, ApJ, 722, 112 [Google Scholar]
- Minchev, I., Anders, F., Recio-Blanco, A., et al. 2018, MNRAS, 481, 1645 [NASA ADS] [CrossRef] [Google Scholar]
- Minniti, D., Lucas, P. W., Emerson, J. P., et al. 2010, New A, 15, 433 [Google Scholar]
- Monelli, M., Gallart, C., Hidalgo, S. L., et al. 2010a, ApJ, 722, 1864 [NASA ADS] [CrossRef] [Google Scholar]
- Monelli, M., Hidalgo, S. L., Stetson, P. B., et al. 2010b, ApJ, 720, 1225 [CrossRef] [Google Scholar]
- Montalbán, J., Mackereth, J. T., Miglio, A., et al. 2021, Nat. Astron., 5, 640 [Google Scholar]
- Nepal, S., Chiappini, C., Guiglion, G., et al. 2024, A&A, 681, L8 [NASA ADS] [CrossRef] [EDP Sciences] [Google Scholar]
- Ness, M., & Freeman, K. 2016, PASA, 33, e022 [Google Scholar]
- Nogueras-Lara, F. 2022, A&A, 666, A72 [NASA ADS] [CrossRef] [EDP Sciences] [Google Scholar]
- Nogueras-Lara, F., Schödel, R., Gallego-Calvente, A. T., et al. 2020, Nat. Astron., 4, 377 [Google Scholar]
- Okalidis, P., Grand, R. J. J., Yates, R. M., & Springel, V. 2022, MNRAS, 514, 5085 [NASA ADS] [CrossRef] [Google Scholar]
- Orkney, M. D. A., Laporte, C. F. P., Grand, R. J. J., et al. 2022, MNRAS, 517, L138 [NASA ADS] [CrossRef] [Google Scholar]
- Pakmor, R., Gómez, F. A., Grand, R. J. J., et al. 2017, MNRAS, 469, 3185 [NASA ADS] [CrossRef] [Google Scholar]
- Pakmor, R., Fragkoudi, F., Grand, R. J. J., et al. 2025, arXiv e-prints [arXiv:2507.22104] [Google Scholar]
- Palicio, P. A., Recio-Blanco, A., Poggio, E., et al. 2023, A&A, 670, L7 [NASA ADS] [CrossRef] [EDP Sciences] [Google Scholar]
- Patel, E., Kallivayalil, N., Garavito-Camargo, N., et al. 2020, ApJ, 893, 121 [Google Scholar]
- Pérez, I., Martínez-Valpuesta, I., Ruiz-Lara, T., et al. 2017, MNRAS, 470, L122 [CrossRef] [Google Scholar]
- Pilkington, K., Gibson, B. K., Brook, C. B., et al. 2012, MNRAS, 425, 969 [Google Scholar]
- Queiroz, A. B. A., Chiappini, C., Perez-Villegas, A., et al. 2021, A&A, 656, A156 [NASA ADS] [CrossRef] [EDP Sciences] [Google Scholar]
- Queiroz, A. B. A., Anders, F., Chiappini, C., et al. 2023, A&A, 673, A155 [NASA ADS] [CrossRef] [EDP Sciences] [Google Scholar]
- Raboud, D., Grenon, M., Martinet, L., Fux, R., & Udry, S. 1998, A&A, 335, L61 [NASA ADS] [Google Scholar]
- Re Fiorentin, P., Spagna, A., Lattanzi, M. G., & Cignoni, M. 2021, ApJ, 907, L16 [NASA ADS] [CrossRef] [Google Scholar]
- Recio-Blanco, A., de Laverny, P., Palicio, P. A., et al. 2023, A&A, 674, A29 [NASA ADS] [CrossRef] [EDP Sciences] [Google Scholar]
- Recio-Blanco, A., de Laverny, P., Palicio, P. A., et al. 2024, A&A, 692, A235 [NASA ADS] [CrossRef] [EDP Sciences] [Google Scholar]
- Renaud, F., Agertz, O., Andersson, E. P., et al. 2021a, MNRAS, 503, 5868 [NASA ADS] [CrossRef] [Google Scholar]
- Renaud, F., Agertz, O., Read, J. I., et al. 2021b, MNRAS, 503, 5846 [NASA ADS] [CrossRef] [Google Scholar]
- Renzini, A., Gennaro, M., Zoccali, M., et al. 2018, ApJ, 863, 16 [NASA ADS] [CrossRef] [Google Scholar]
- Rich, R. M., Reitzel, D. B., Howard, C. D., & Zhao, H. 2007, ApJ, 658, L29 [NASA ADS] [CrossRef] [Google Scholar]
- Romero-Gómez, M., Masdemont, J. J., Athanassoula, E., & García-Gómez, C. 2006, A&A, 453, 39 [NASA ADS] [CrossRef] [EDP Sciences] [Google Scholar]
- Roškar, R., Debattista, V. P., Quinn, T. R., & Wadsley, J. 2012, MNRAS, 426, 2089 [Google Scholar]
- Ruiz-Lara, T., Gallart, C., Bernard, E. J., & Cassisi, S. 2020, Nat. Astron., 4, 965 [NASA ADS] [CrossRef] [Google Scholar]
- Ruiz-Lara, T., Gallart, C., Monelli, M., et al. 2021, MNRAS, 501, 3962 [NASA ADS] [CrossRef] [Google Scholar]
- Ruiz-Lara, T., Helmi, A., Gallart, C., Surot, F., & Cassisi, S. 2022, A&A, 668, L10 [NASA ADS] [CrossRef] [EDP Sciences] [Google Scholar]
- Rusakov, V., Monelli, M., Gallart, C., et al. 2021, MNRAS, 502, 642 [NASA ADS] [CrossRef] [Google Scholar]
- Sahu, K. C., Smith, T. E., & Clarkson, W. 2006, in American Astronomical Society Meeting Abstracts, 209, American Astronomical Society Meeting Abstracts, 162.21 [Google Scholar]
- Saito, R. K., Zoccali, M., McWilliam, A., et al. 2011, AJ, 142, 76 [NASA ADS] [CrossRef] [Google Scholar]
- Saito, R. K., Minniti, D., Dias, B., et al. 2012, A&A, 544, A147 [NASA ADS] [CrossRef] [EDP Sciences] [Google Scholar]
- Saito, R. K., Hempel, M., Alonso-García, J., et al. 2024, A&A, 689, A148 [NASA ADS] [CrossRef] [EDP Sciences] [Google Scholar]
- Salaris, M., Chieffi, A., & Straniero, O. 1993, ApJ, 414, 580 [NASA ADS] [CrossRef] [Google Scholar]
- Sánchez-Blázquez, P., Courty, S., Gibson, B. K., & Brook, C. B. 2009, MNRAS, 398, 591 [CrossRef] [Google Scholar]
- Sanders, J. L., Kawata, D., Matsunaga, N., et al. 2024, MNRAS, 530, 2972 [NASA ADS] [CrossRef] [Google Scholar]
- Schönrich, R., & Binney, J. 2009, MNRAS, 396, 203 [Google Scholar]
- Seo, W.-Y., Kim, W.-T., Kwak, S., et al. 2019, ApJ, 872, 5 [NASA ADS] [CrossRef] [Google Scholar]
- Shen, S., Wadsley, J., & Stinson, G. 2010, MNRAS, 407, 1581 [NASA ADS] [CrossRef] [Google Scholar]
- Soderblom, D. R. 2010, ARA&A, 48, 581 [Google Scholar]
- Stanek, K. Z., Mateo, M., Udalski, A., et al. 1994, ApJ, 429, L73 [NASA ADS] [CrossRef] [Google Scholar]
- Sumi, T., Eyer, L., & Wozniak, P. R. 2003, MNRAS, 340, 1346 [Google Scholar]
- Surot, F., Valenti, E., Gonzalez, O. A., et al. 2020, A&A, 644, A140 [NASA ADS] [CrossRef] [EDP Sciences] [Google Scholar]
- Trevisan, M., Barbuy, B., Eriksson, K., et al. 2011, A&A, 535, A42 [NASA ADS] [CrossRef] [EDP Sciences] [Google Scholar]
- Udalski, A., Szymanski, M. K., & Szymanski, G. 2015, Acta Astron., 65, 1 [Google Scholar]
- Ulrich, R. K. 1986, ApJ, 306, L37 [Google Scholar]
- van Loon, J. T., Gilmore, G. F., Omont, A., et al. 2003, MNRAS, 338, 857 [NASA ADS] [CrossRef] [Google Scholar]
- Vasiliev, E., Belokurov, V., & Erkal, D. 2021, MNRAS, 501, 2279 [NASA ADS] [CrossRef] [Google Scholar]
- Voglis, N., Tsoutsis, P., & Efthymiopoulos, C. 2006, MNRAS, 373, 280 [NASA ADS] [CrossRef] [Google Scholar]
- Wegg, C., & Gerhard, O. 2013, MNRAS, 435, 1874 [Google Scholar]
- Zhang, H., Belokurov, V., Evans, N. W., et al. 2024, MNRAS, 535, 2873 [Google Scholar]
- Zoccali, M., & Valenti, E. 2024, arXiv e-prints [arXiv:2412.01607] [Google Scholar]
- Zoccali, M., Renzini, A., Ortolani, S., et al. 2003, A&A, 399, 931 [NASA ADS] [CrossRef] [EDP Sciences] [Google Scholar]
- Zoccali, M., Hill, V., Lecureur, A., et al. 2008, A&A, 486, 177 [NASA ADS] [CrossRef] [EDP Sciences] [Google Scholar]
- Zoccali, M., Gonzalez, O. A., Vasquez, S., et al. 2014, A&A, 562, A66 [NASA ADS] [CrossRef] [EDP Sciences] [Google Scholar]
- Zoccali, M., Vasquez, S., Gonzalez, O. A., et al. 2017, A&A, 599, A12 [NASA ADS] [CrossRef] [EDP Sciences] [Google Scholar]
We note here that the bulge region of the original Auriga simulations were thoroughly studied in Gargiulo et al. (2019), demonstrating a prevalence of pseudo-bulges.
Given the proximity of the sources and the quality of the Gaia parallaxes, the inverse of the parallax is a good approximation to the real distance in our case (Bailer-Jones et al. 2018; Luri et al. 2018). In order to compute the distance to each star, we first corrected its parallax using individual zero-point offsets (Lindegren et al. 2021) from the gaiadr3-zeropoint Python package. We also included a systematic uncertainty of 0.015 mas in the zero-point by adding this in quadrature with the parallaxes uncertainties.
We computed solutions for three different samples: above the plane, below the plane, and above and below together. The results were totally compatible, suggesting symmetry. For this reason, we decided to bin together stars with positive and negative z-values, allowing us to have a larger number of stars per volume and, in consequence, better fits.
CMD-fitting techniques are based on the comparison of observed CMDs with synthetic model ones (based on stellar evolution theory) in order to derive the best combination of simple stellar populations that fits the observed CMD, i.e. recovering the age and metallicity characteristics of the stars in the analysed system.
BaSTI stands for a Bag of Stellar Tracks and Isochrones.
‘S bins’ provide the seeds in age and metallicity used to define single stellar populations in the synthetic CMD and are ages=[0.02, 0.06, 0.126, 0.192, 0.262, 0.334, 0.404, 0.469, 0.532, 0.596, 0.656, 0.718, 0.784, 0.857, 0.938, 1.028, 1.128, 1. 244, 1.391, 1.576, 1.81, 2.066, 2.337, 2.609, 2.882, 3.156, 3.427, 3.695, 3.978, 4.272, 4.581, 4.946, 5.389, 5.858, 6.351, 6.8 61, 7.372, 7.883, 8.393, 8.904, 9.415, 9.925, 10.436, 10.947, 11.457, 11.968, 12.479, 12.989, 13.5] Gyr. The weighing scheme refers to the importance that each region in the colour-magnitude plane has in the final fit.
To further check this possibility, we also investigated a different cylinder with a lower radius extent. Totally compatible results are found for all events (including the oldest one) fully ruling out that reddening might artificially create these features.
We subtracted 0.4 dex from the iron abundance of the star particles, consistent with previous studies of the Auriga simulations (e.g. Grand et al. 2020).
Some relevant information on this particular halo: log(MTotal) = 10.062; log(M*) = 8.3; infall time: 8 Gyr ago.
We note that our results are given in terms of global metallicities ([M/H]), so in principle the iron abundance estimates by Recio-Blanco et al. (2024) should be transformed to [M/H] by accounting for the corresponding [a/Fe] and a rescaling law (see e.g. Salaris et al. 1993). However, since the selected stellar sample corresponds to metal-rich stars with a very low - if any - α-element enhancement, we decided to not apply any transformation for the purpose of the present comparison, so assuming that [Fe/H] ∼ [M/H] ∼ [Z/H] (global metallicity, as appropriate for solar-scaled stars).
All dynamical parameters have been taken from Recio-Blanco et al. (2024), with the exception of guiding radius that has been computed as the average of the apocentric and pericentric radii, i.e. (Rperi+Rapo)/2. For more details see Palicio et al. (2023).
We adjusted a range of metallicities around the solar value to have about the same number of stars in the solar regime as in the high metal-licity range defined above. To be precise, we considered a star to be a solar-metallicity star if its metallicity is in the range 0.0000±0.0175 ([Fe/H]).
All Figures
|
Fig. 1 Stellar density distribution in the age-metallicity plane for volumes 1, 5, and 8 (i.e. from the plane to 50 pc, 0.2-0.3 kpc, and 0.5-0.6 kpc, respectively, above and below the plane) as representative examples of the reported super-metal-rich populations (for these we used the Lallement et al. 2022 dust map). Coloured polygons delimit the areas in the age-metallicity plane used to quantify the z-profiles in Fig. 2. Note that a logarithmic scale has been used to represent the number of stars in order to enhance these relatively low-intensity features. |
| In the text | |
|
Fig. 2 Redshift profile of the number density of stars for the five different events of super-metal-rich star formation. Such events are defined using the polygons depicted in Fig. 1. We show the profiles using two different extinction maps, the Bayestar map (Green et al. 2019, dashed lines) and the Lallement et al. (2022) map (solid lines, L22). Given incompleteness affecting the observed samples together with quality cuts, absolute values for this number density should be taken with caution. A normalisation has been applied to the Bayestar densities to account for the missing quadrant in the Bayestar coverage (see Green et al. 2019). Colours have the same meanings as in Fig. 1. |
| In the text | |
|
Fig. 3 Stellar age-metallicity distribution of stellar particles for a solar neighbourhood-like selection of stars from AuS18. The distribution of stars are colour-coded according to number density (left) and birth radius (right). Pericentric passages of subhalo 6281 are shown as pink squares. |
| In the text | |
|
Fig. 4 Kiel diagram of the disc super-metal-rich population with [M/H]=0.4±0.1 dex. We divide the sample in two based on their value of vφ: slow (purple) and fast (orange) stars (see Fig. 5). Solar-scaled BaSTI isochrones of 13.5, 10, 7, 4, 2, 1, and 0.6 Gyr (red, orange, teal, green, cyan, blue, and purple, respectively) are overlaid on the data. Left : whole diagram. Right : turnoff region only. |
| In the text | |
|
Fig. 5 Orbital properties of the metal-rich stars detected in the high-quality Gaia DR3 GSP-Spec sub-catalogue from Recio-Blanco et al. (2024), compared with those of a subset of solar-metallicity stars. Left : distribution of vφ velocities for metal-rich (red, empty histogram) and solar-metallicity (grey histogram) stars. From the shape of the metal-rich stars histogram we divide the sample into slow (|vφ| below 205 km/s) and fast (|vφ| above 205 km/s) stars. Middle : distribution of guiding radius (from Recio-Blanco et al. 2024). Right : distribution of eccentricity (from Recio-Blanco et al. 2024). For these last panels, we divide the sample into solar metallicity (grey), slow, metal-rich stars (purple) and fast, metal-rich stars (orange). |
| In the text | |
|
Fig. 6 Integrated stellar age distribution of the stars within 0.6 kpc of the plane of the disc (|z|<0.6 kpc). We show all the stars (shaded black area), the metal-rich stars ([M/H] ≥ 0.3, red), and the remaining stars ([M/H] < 0.3, blue). |
| In the text | |
Current usage metrics show cumulative count of Article Views (full-text article views including HTML views, PDF and ePub downloads, according to the available data) and Abstracts Views on Vision4Press platform.
Data correspond to usage on the plateform after 2015. The current usage metrics is available 48-96 hours after online publication and is updated daily on week days.
Initial download of the metrics may take a while.