Fig. 2
Download original image
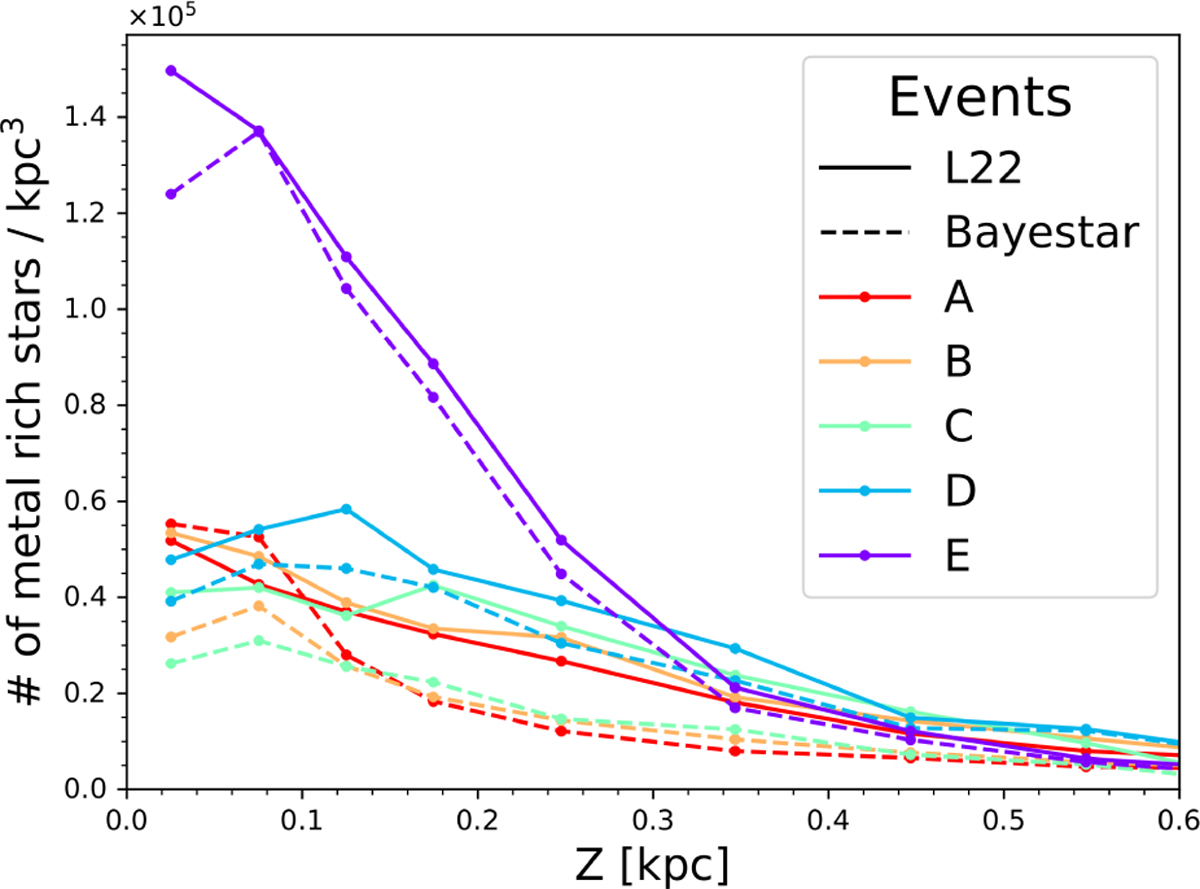
Redshift profile of the number density of stars for the five different events of super-metal-rich star formation. Such events are defined using the polygons depicted in Fig. 1. We show the profiles using two different extinction maps, the Bayestar map (Green et al. 2019, dashed lines) and the Lallement et al. (2022) map (solid lines, L22). Given incompleteness affecting the observed samples together with quality cuts, absolute values for this number density should be taken with caution. A normalisation has been applied to the Bayestar densities to account for the missing quadrant in the Bayestar coverage (see Green et al. 2019). Colours have the same meanings as in Fig. 1.
Current usage metrics show cumulative count of Article Views (full-text article views including HTML views, PDF and ePub downloads, according to the available data) and Abstracts Views on Vision4Press platform.
Data correspond to usage on the plateform after 2015. The current usage metrics is available 48-96 hours after online publication and is updated daily on week days.
Initial download of the metrics may take a while.