Open Access
Fig. A.8.
Download original image
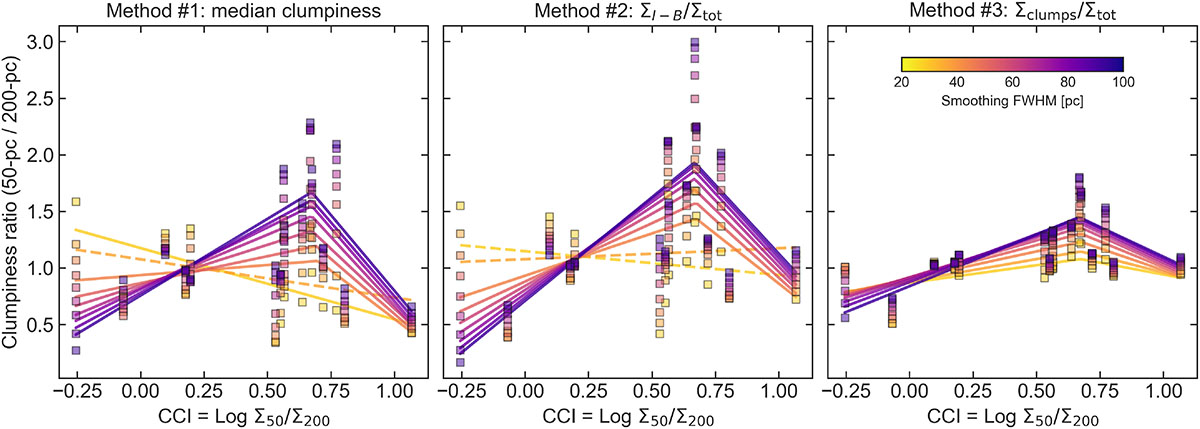
Ratio of clumpiness measured within the 50 pc radius aperture to that within the 200 pc radius aperture, plotted as a function of the cold molecular gas concentration index, CCI ≡log(Σ50/Σ200). Panels, lines, and markers are as in Figure 2.
Current usage metrics show cumulative count of Article Views (full-text article views including HTML views, PDF and ePub downloads, according to the available data) and Abstracts Views on Vision4Press platform.
Data correspond to usage on the plateform after 2015. The current usage metrics is available 48-96 hours after online publication and is updated daily on week days.
Initial download of the metrics may take a while.