Fig. A.3.
Download original image
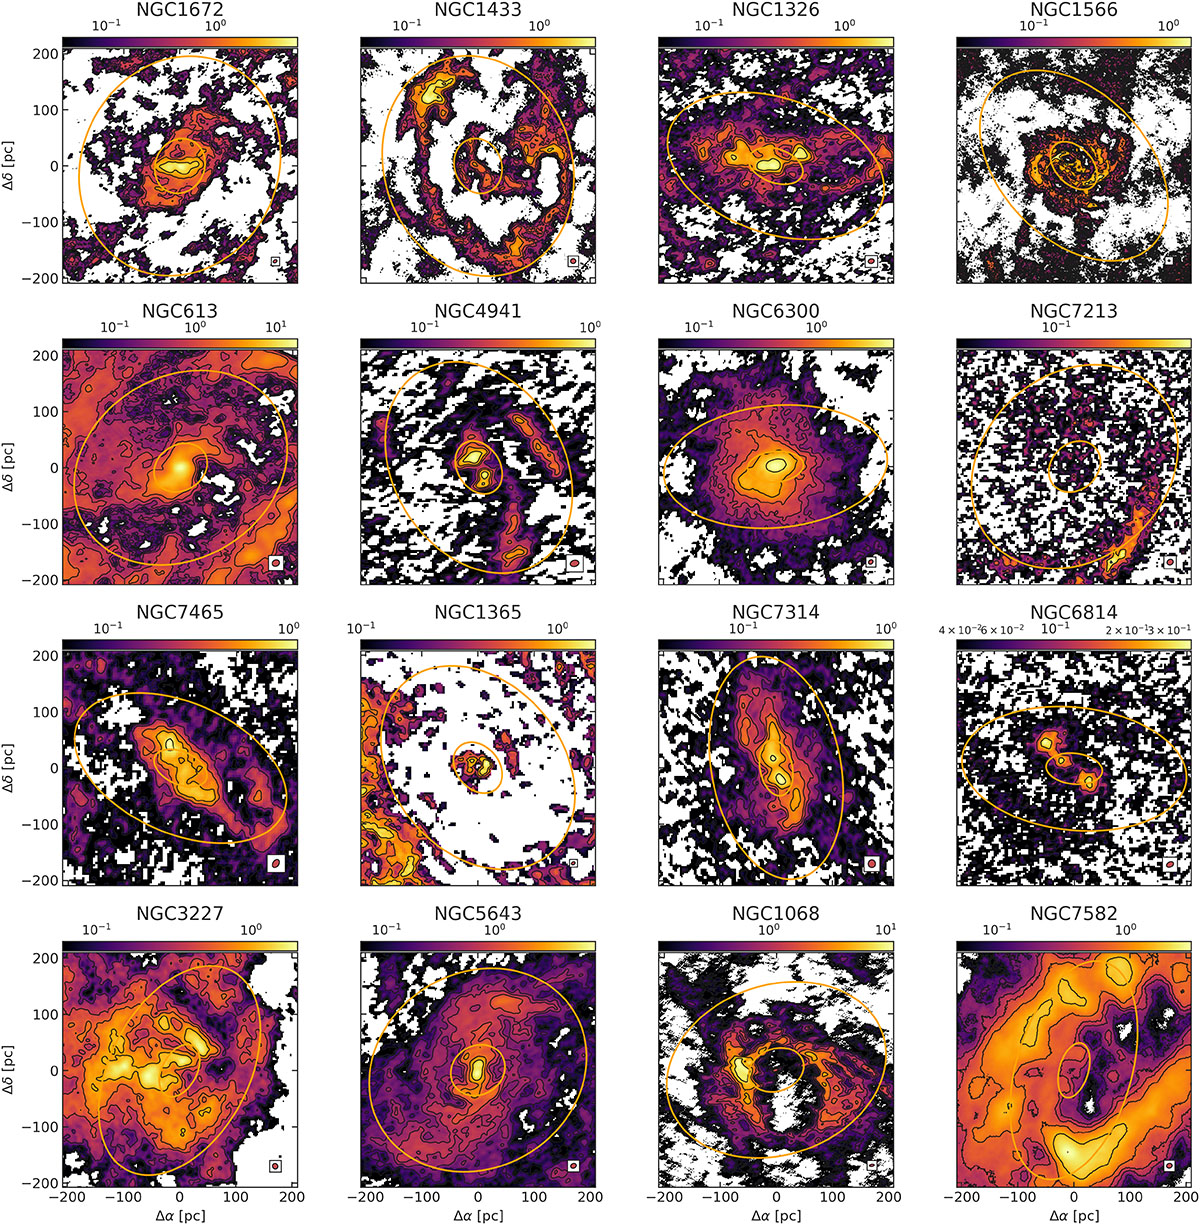
CO(3 − 2) images of the sample galaxies. Each image covers a region of 400 pc × 400 pc, as in Figure 1. The two ellipses in each panel correspond to circles with radii of 50 and 200 pc projected onto the plane of the galaxy. The galaxies are ordered by increasing 2 − 10 keV luminosity, from top-left to bottom-right. The contours correspond to (3, 5, 10, 20, 30, 50, 100, 200)×σ. The red ellipse inside the white square at the bottom-right corner of each panel represents the ALMA beam.
Current usage metrics show cumulative count of Article Views (full-text article views including HTML views, PDF and ePub downloads, according to the available data) and Abstracts Views on Vision4Press platform.
Data correspond to usage on the plateform after 2015. The current usage metrics is available 48-96 hours after online publication and is updated daily on week days.
Initial download of the metrics may take a while.