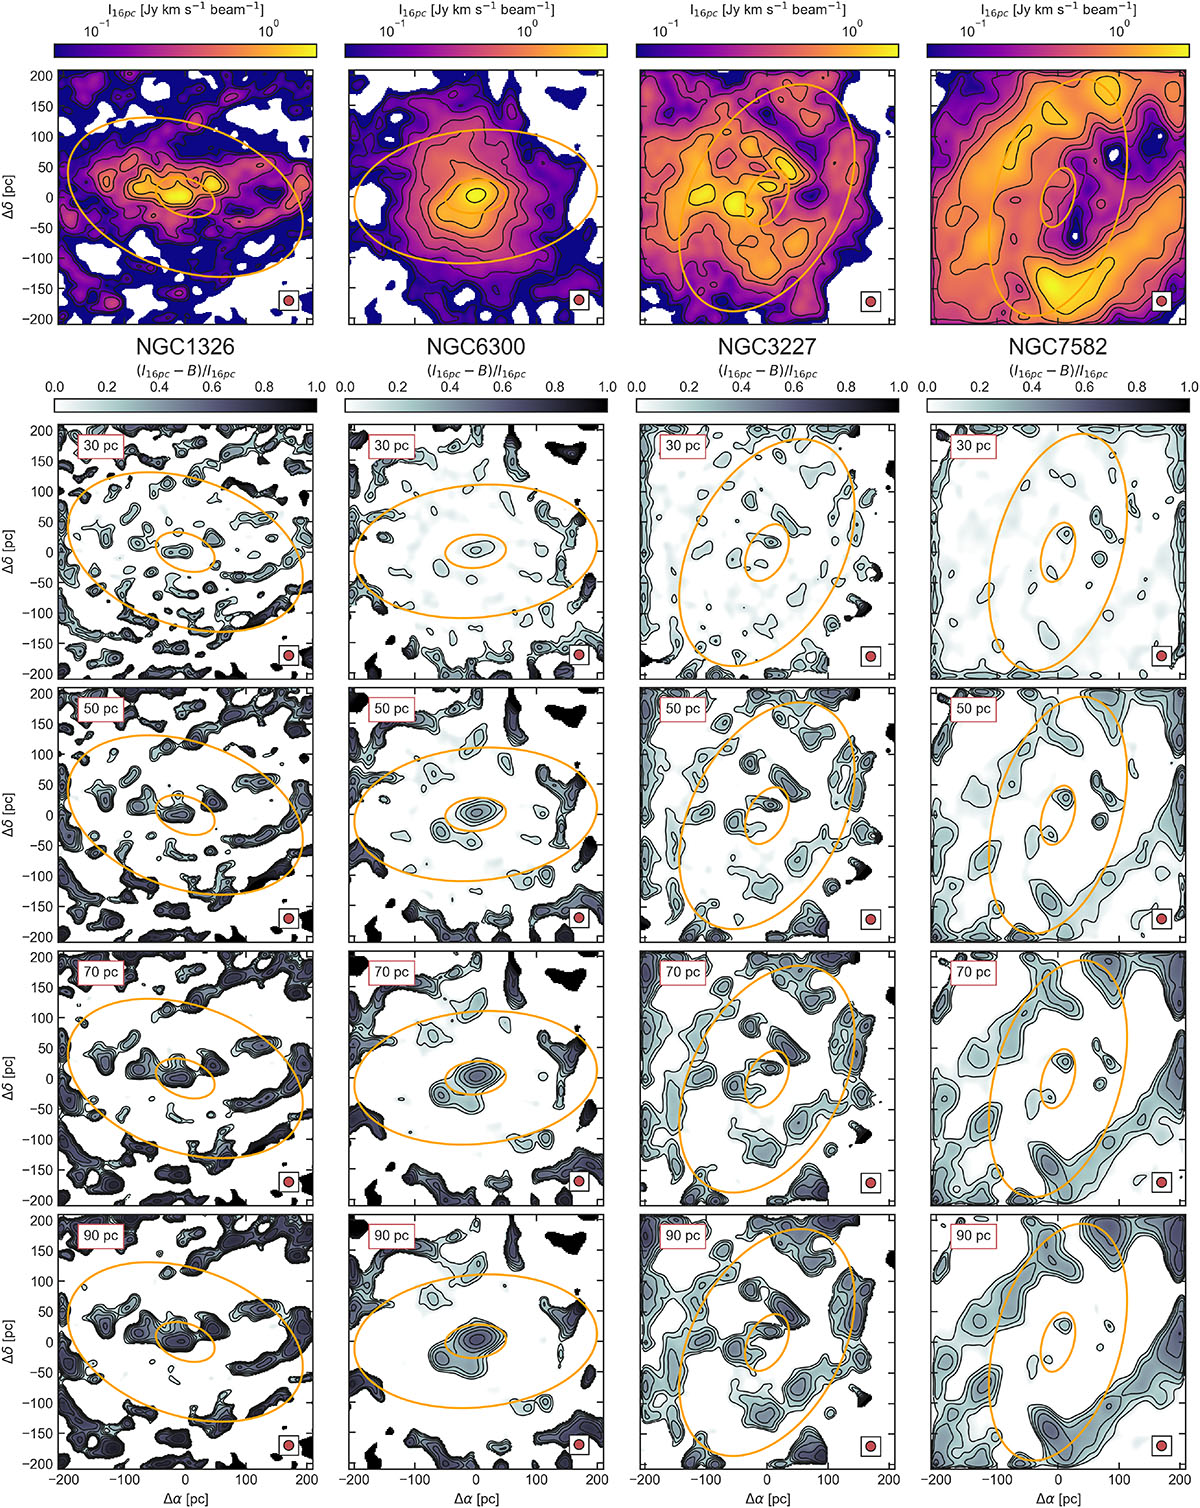
Fig. A.4.
Download original image
CO(3 − 2) maps smoothed to a common physical resolution of 16 pc for four representative galaxies (top row): NGC 1326, NGC 6300, NGC 3227, and NGC 7582 (from left to right). The contours are the same as those in Figure A.3. The color bars indicate flux in Jy km s−1 beam−1. From the second to the fifth row, for each galaxy (each column), we show the clumpiness map computed with Method #1 using Gaussian smoothing kernels with a FWHM of 30, 50, 70, and 90 pc (from top to bottom). Contours are plotted every 0.1 between 0 and 1. The two ellipses in each panel correspond to circles with radii of 50 and 200 pc projected onto the plane of the galaxy. The red ellipse inside the white square at the bottom-right corner of each panel represents the ALMA beam.
Current usage metrics show cumulative count of Article Views (full-text article views including HTML views, PDF and ePub downloads, according to the available data) and Abstracts Views on Vision4Press platform.
Data correspond to usage on the plateform after 2015. The current usage metrics is available 48-96 hours after online publication and is updated daily on week days.
Initial download of the metrics may take a while.