Fig. 4
Download original image
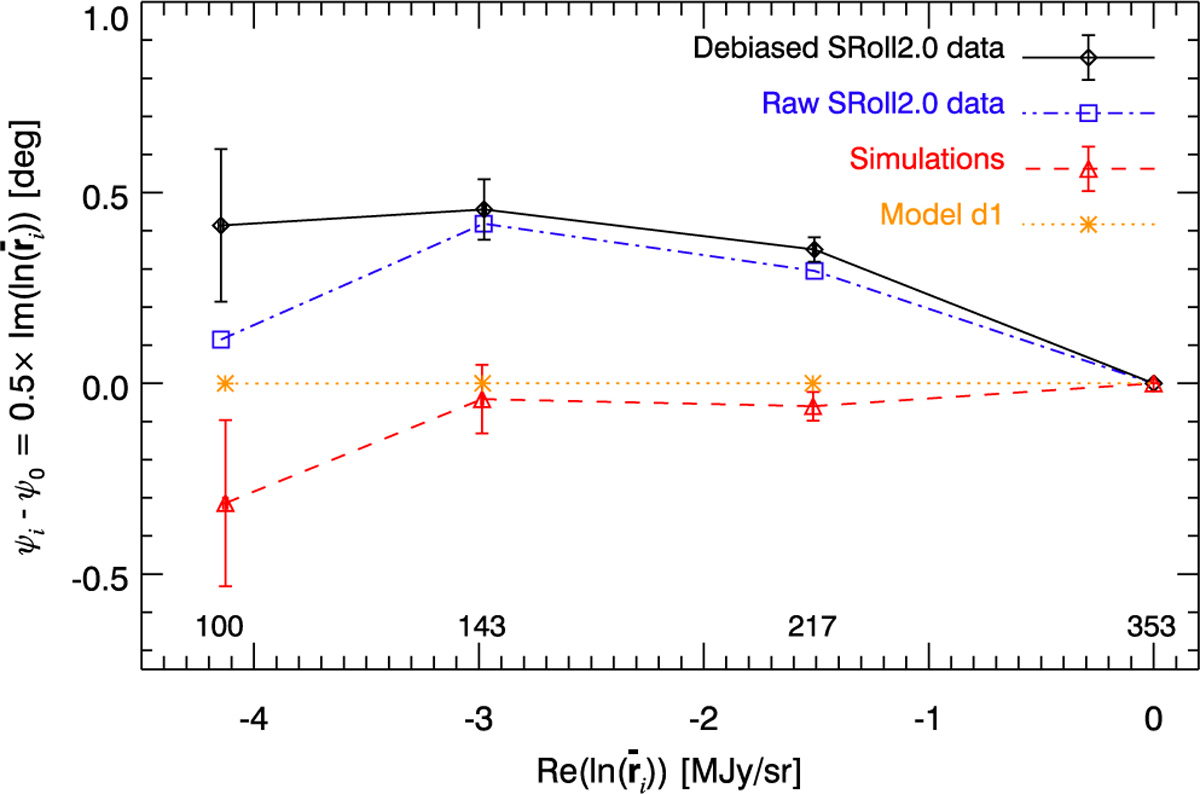
Mean complex polarized SED ![]() in the log complex plane for our 97% mask: debiased SRoll2 data (solid black line), raw SRoll2 data (dashed-dotted blue line), simulations (mean shown by the dashed red line with error bars representing the standard deviation), and the model d1 (dotted line). Errors bars are based on 200 simulations (see Sect. 4.3). Planck-HFI frequencies are indicated.
in the log complex plane for our 97% mask: debiased SRoll2 data (solid black line), raw SRoll2 data (dashed-dotted blue line), simulations (mean shown by the dashed red line with error bars representing the standard deviation), and the model d1 (dotted line). Errors bars are based on 200 simulations (see Sect. 4.3). Planck-HFI frequencies are indicated.
Current usage metrics show cumulative count of Article Views (full-text article views including HTML views, PDF and ePub downloads, according to the available data) and Abstracts Views on Vision4Press platform.
Data correspond to usage on the plateform after 2015. The current usage metrics is available 48-96 hours after online publication and is updated daily on week days.
Initial download of the metrics may take a while.