Fig. 5
Download original image
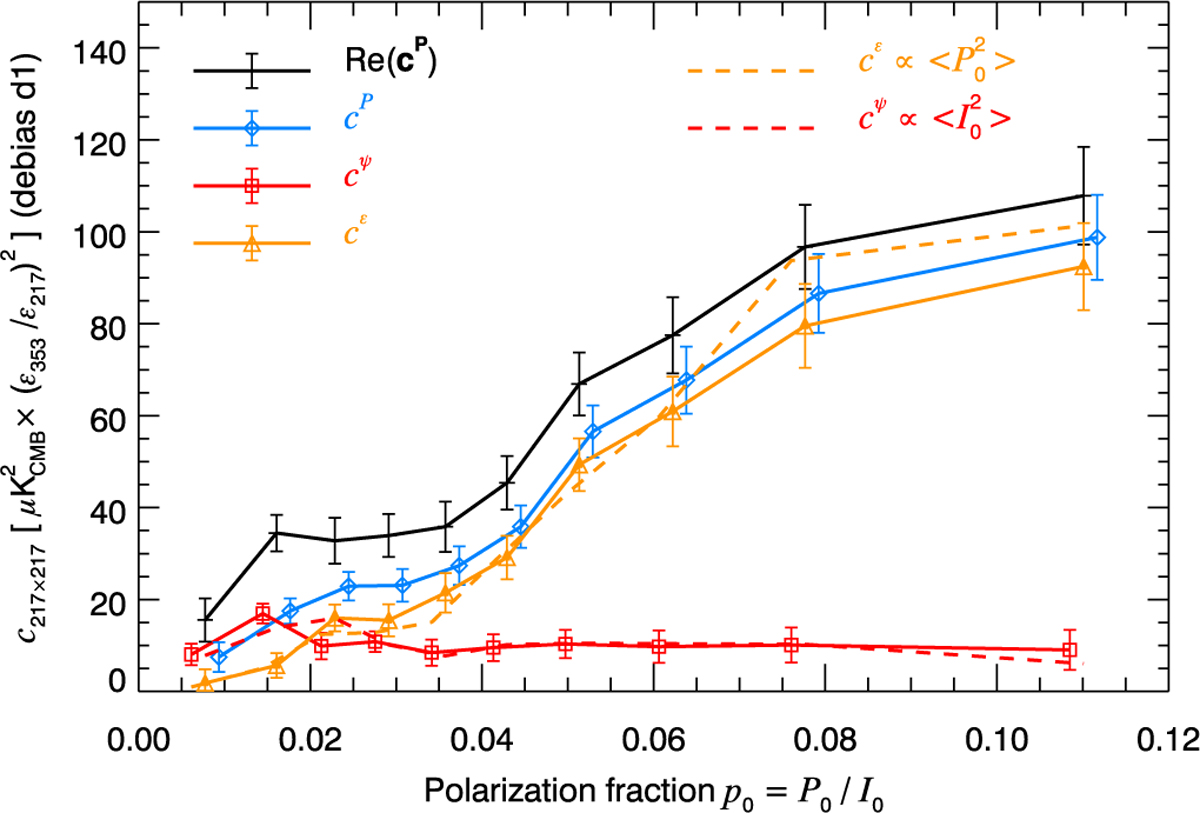
Test of predictions P2, P3, and P4: dependence on the observed polarization fraction p0 = P0/I0 at 353 GHz of the variances Re cP, cP, cψ, and cε computed at 217 GHz. Our models for cε (P2) and cψ (P3) are overplotted as dotted orange and red lines, respectively, using the mean value of the slope derived from these equations, multiplied by ![]() and
and ![]() in each bin of p0 = P0/I0.
in each bin of p0 = P0/I0.
Current usage metrics show cumulative count of Article Views (full-text article views including HTML views, PDF and ePub downloads, according to the available data) and Abstracts Views on Vision4Press platform.
Data correspond to usage on the plateform after 2015. The current usage metrics is available 48-96 hours after online publication and is updated daily on week days.
Initial download of the metrics may take a while.