Open Access
Fig. 9
Download original image
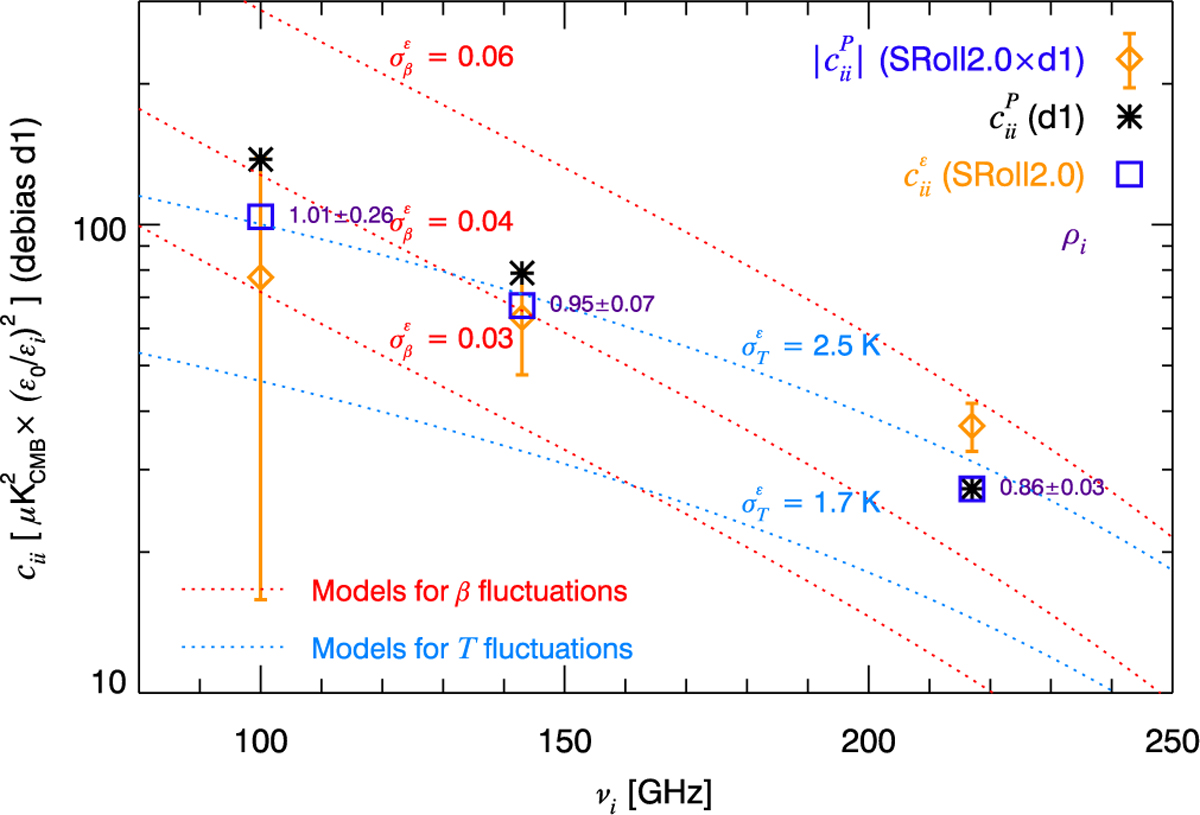
Comparison of the spectral dependence of covariances cε from SRoll2 data, cP for the dust model d1, and cP for the cross-product of SRoll2 and d1. The Pearson correlation coefficient ρ(d1, SR) is indicated (purple). Predictions for models with T or β fluctuations are overplotted.
Current usage metrics show cumulative count of Article Views (full-text article views including HTML views, PDF and ePub downloads, according to the available data) and Abstracts Views on Vision4Press platform.
Data correspond to usage on the plateform after 2015. The current usage metrics is available 48-96 hours after online publication and is updated daily on week days.
Initial download of the metrics may take a while.