Fig. 1.
Download original image
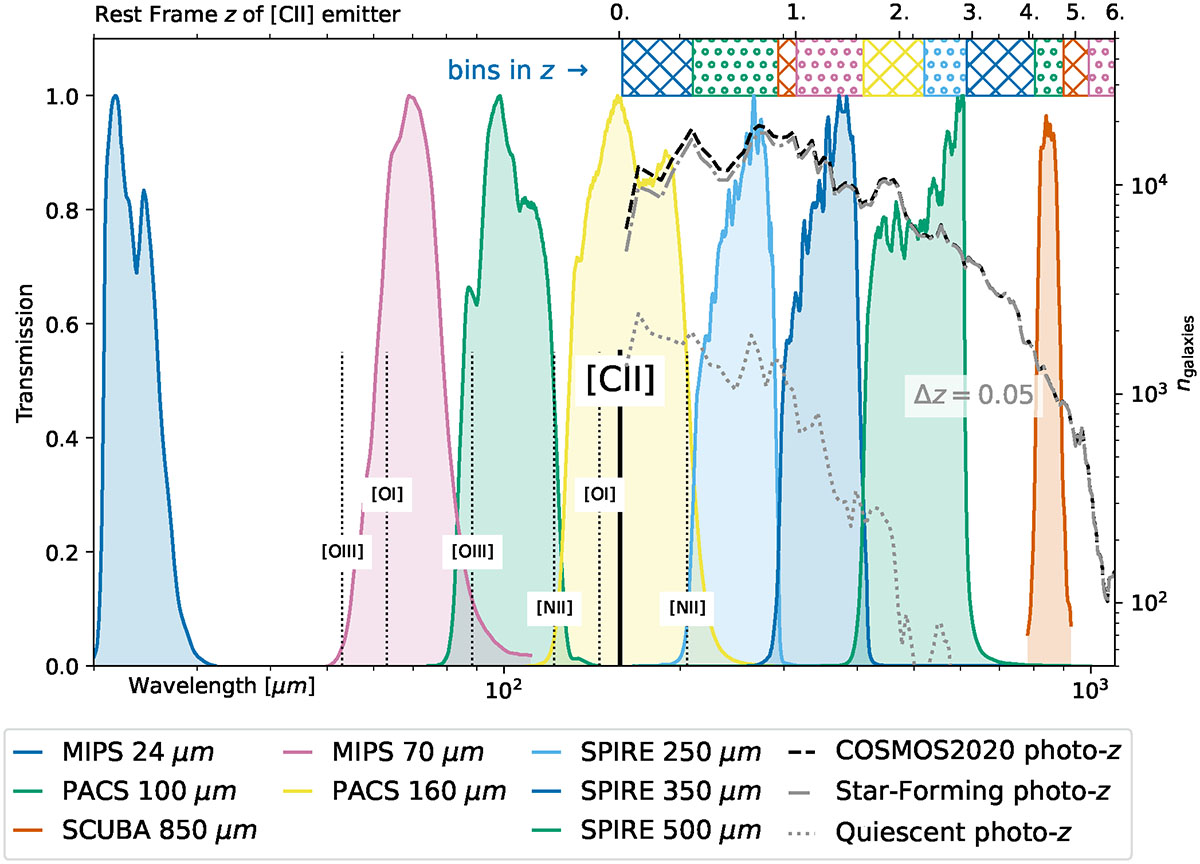
Overview of data used in our analysis. We include transmission curves (left vertical, bottom horizontal axes) for the eight broadband maps used, from Spitzer, Herschel, and SCUBA-2. We overplot the rest-frame wavelengths of selected FIR emission lines, including [CII]-158 μm; these lines are redshifted into the broadband maps. The top horizontal axis labels translate the observer wavelengths into the rest-frame redshift z of a [CII]-158 μm emitter. We trace the z distribution of the COSMOS2020 photometric catalog (in bins of Δz = 0.05), with number counts on the right vertical axis; number counts for the selection of star-forming or quiescent emitters are also shown. Redshifted C+ emission will appear in the SPIRE maps for specific z ranges. Finally, at the top, we demarcate the z-binning used for stacking with LinSimStack; bins at z ∼ 0.65, 1.3, 2.1, and 2.6 were chosen to overlap with the SPIRE bands.
Current usage metrics show cumulative count of Article Views (full-text article views including HTML views, PDF and ePub downloads, according to the available data) and Abstracts Views on Vision4Press platform.
Data correspond to usage on the plateform after 2015. The current usage metrics is available 48-96 hours after online publication and is updated daily on week days.
Initial download of the metrics may take a while.