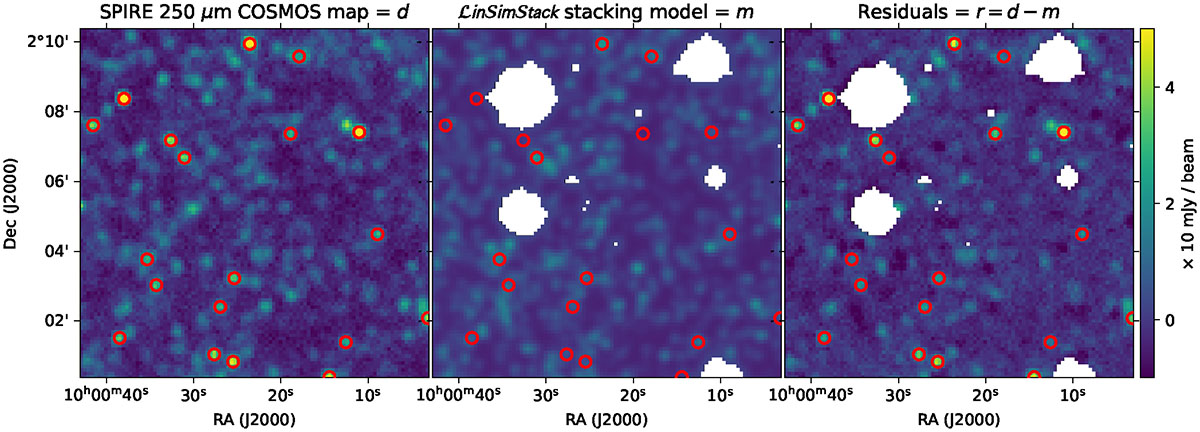
Fig. 2.
Download original image
Zoom-in on the stacking outputs for the Herschel/SPIRE 250 μm COSMOS map, illustrating our forward modeling LinSimStack methodology. Left to right: 2D vectors for the data d, model m, and the residuals r = d − m. The model m is a linear combination of all beam-convolved hit-maps constructed using the COSMOS2020 photometric catalog. We also plot sources from the Herschel/SPIRE Point Source Catalog (HSPSC) with estimated fluxes in the HSPSC above 30 mJy, which correlate with the residual flux in the 2D vector r (see Section 3.4, Appendix A, the corresponding figures, and the discussion for further details on model incompleteness).
Current usage metrics show cumulative count of Article Views (full-text article views including HTML views, PDF and ePub downloads, according to the available data) and Abstracts Views on Vision4Press platform.
Data correspond to usage on the plateform after 2015. The current usage metrics is available 48-96 hours after online publication and is updated daily on week days.
Initial download of the metrics may take a while.