Fig. 4.
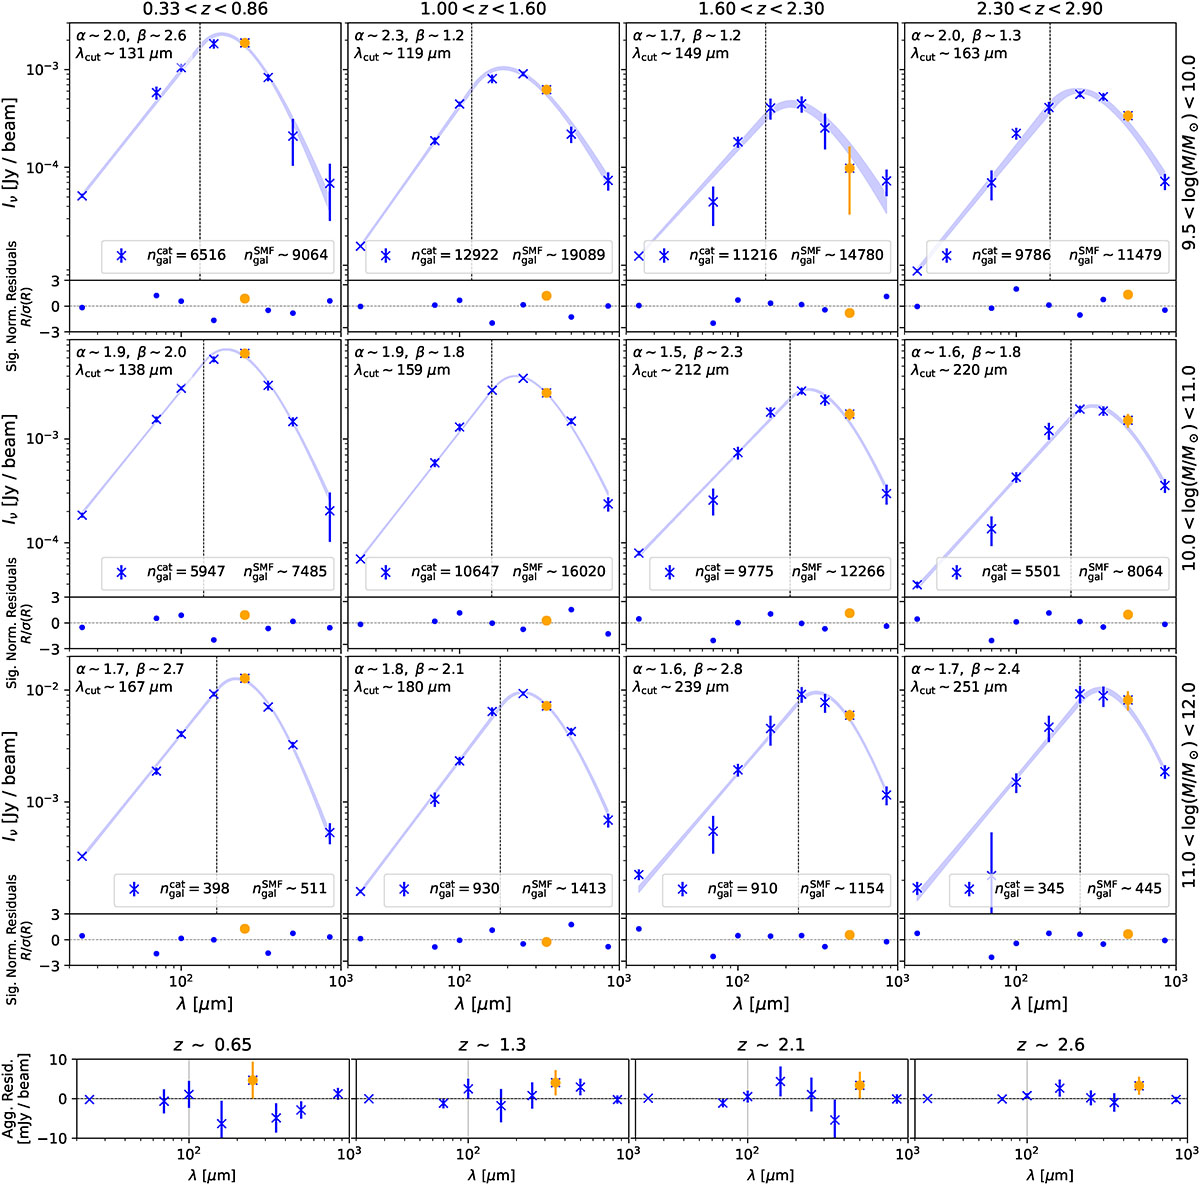
Download original image
Stacked intensity estimates obtained from LinSimStack for individual COSMOS2020 bins, fit with a modified black-body emission continuum SED model. The top panels of each sub-figure show the stacked mean intensities (blue crosses) and corresponding 1σ envelope of the emcee fits (blue) for a subset of the catalog bins; the bottom panels show the signal-to-noise of the fit residuals. The vertical dashed line represents the wavelength cut, λcut, between the two piecewise components of the SED continuum model in Eq. (3) (i.e., the frequency ν0). For a specific z interval, [CII]-158 μm emission is redshifted into a SPIRE band and manifests as excess residual emission over the continuum; these are marked in orange. The SPIRE 500 μm map contains redshifted [CII]-158 μm from the highest two z bins. Different rows and columns correspond to different stellar mass log(M/M⊙) and redshift z cuts; all bins shown here are from the star-forming selection. The labels indicate the number count within a bin in the catalog and as predicted by the stellar mass function (SMF) from Weaver et al. (2023). We conservatively inflate the variance on the [CII]-158 μm residual emission by the reduced chi-squared, χr2, statistic of each SED fit. The bottom row shows residuals obtained by adding over all bins at the same redshift interval, with potential [CII]-158 μm emission again marked in orange. For brevity, we only show stacking within the three highest stellar mass bins (for each redshift bin with potential [CII]-158 μm emission); these are the predominant contributors to the CIB and [CII]-158 μm emission. (See Appendix B for stacking results in all bins.) The bottom row shows the residuals obtained by adding all stellar mass and star-forming plus quiescent bins at a redshift.
Current usage metrics show cumulative count of Article Views (full-text article views including HTML views, PDF and ePub downloads, according to the available data) and Abstracts Views on Vision4Press platform.
Data correspond to usage on the plateform after 2015. The current usage metrics is available 48-96 hours after online publication and is updated daily on week days.
Initial download of the metrics may take a while.