Fig. 6.
Download original image
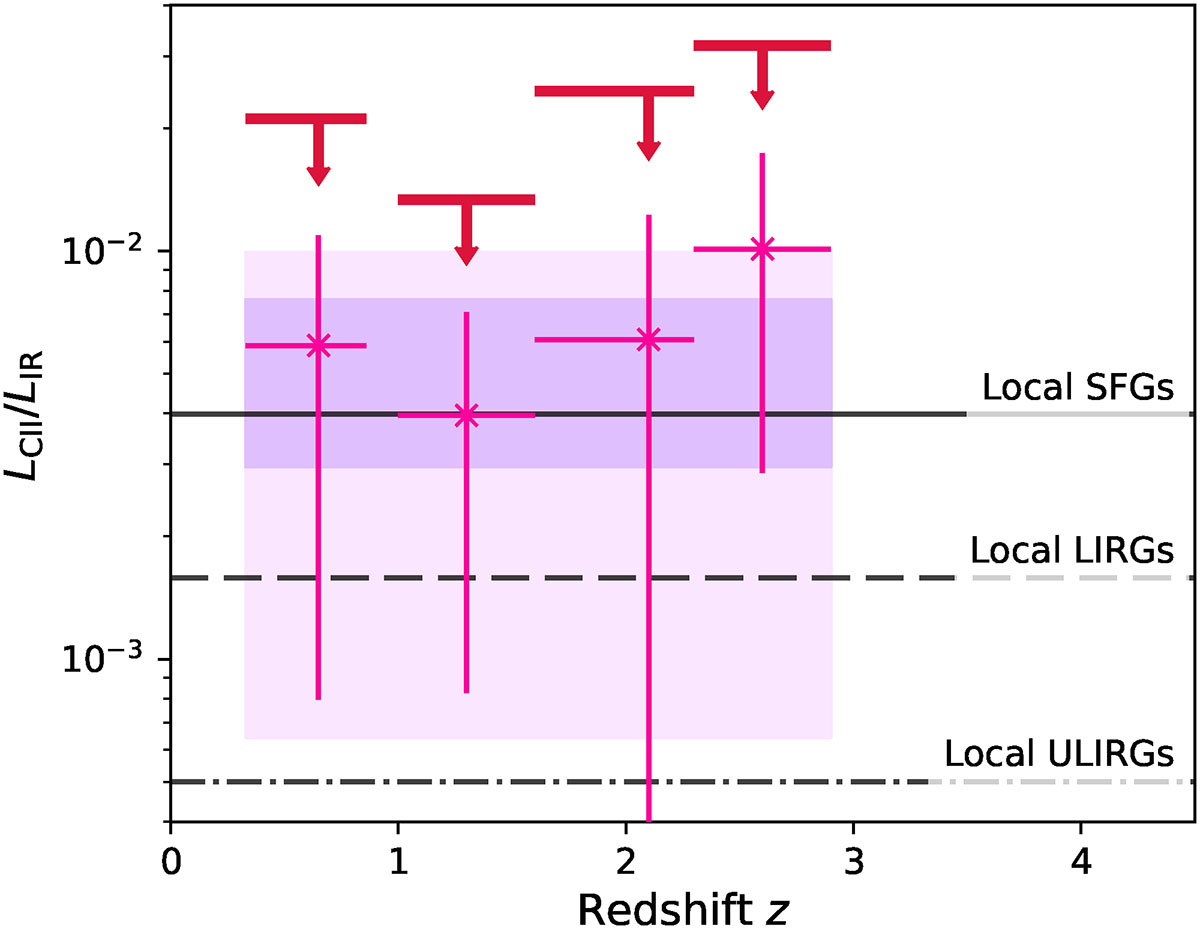
Population-average [CII]-to-IR luminosity ratios, derived comparing our [CII] constraints with integrated IR luminosity function of Gruppioni et al. (2013). Red limits and pink crosses indicate 3σ upper bounds and 1σ intervals in each redshift bin. Purple bars show the variance-weighted average over all bins (z ∼ 0.33 − 2.9), with dark purple and light purple indicating 1σ and 2σ intervals. We also show the average ratios for local SFGs from [CII] observations from Accurso et al. (2017), and for LIRGs and ULIRGs from Díaz-Santos et al. (2017).
Current usage metrics show cumulative count of Article Views (full-text article views including HTML views, PDF and ePub downloads, according to the available data) and Abstracts Views on Vision4Press platform.
Data correspond to usage on the plateform after 2015. The current usage metrics is available 48-96 hours after online publication and is updated daily on week days.
Initial download of the metrics may take a while.