Fig. A.1.
Download original image
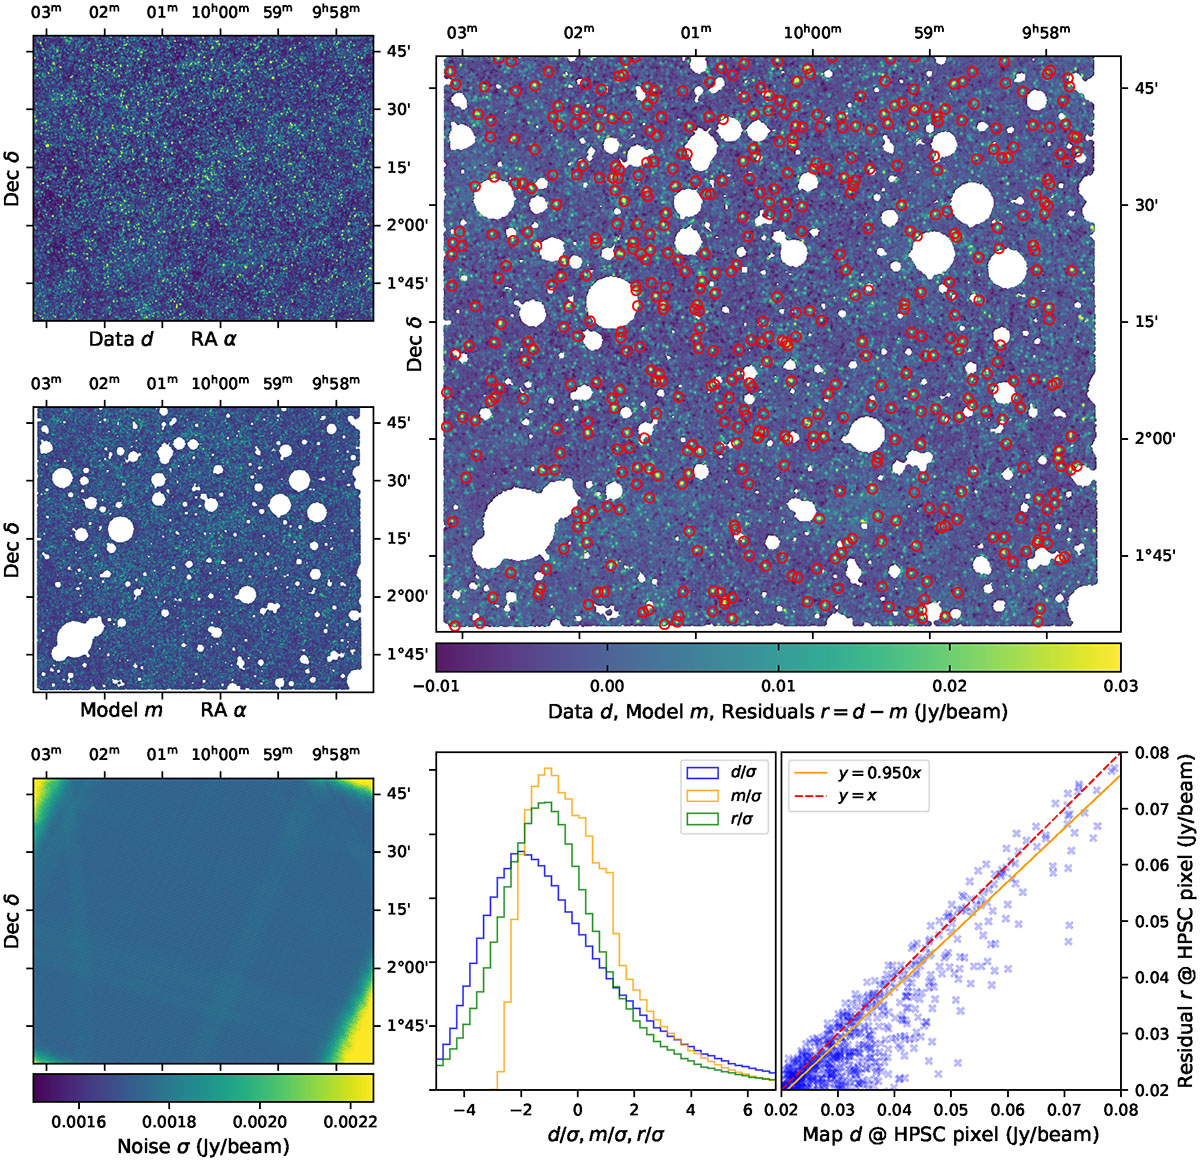
Left Top:Herschel/SPIRE 250 μm map of the COSMOS field, used in the forward modeling framework of LinSimStack as the data vector d. This corresponds to our z ∼ 0.65 tomographic bin for [CII]-158 μm. Left Middle: Model m from LinSimStack, a linear combination of hit-maps of individual bins, convolved with the 250 μm beam, with the coverage mask of COSMOS2020 applied. Top Right: Residuals d − m not resolved by LinSimStack. We overplot the positions of the brightest 500 COSMOS sources in the Herschel SPIRE Point Source Catalog at 250 μm. Bottom Left: Per-pixel noise in the 250 μm map. Bottom middle: Histograms of the data, LinSimStack fit, and the unresolved residuals, all scaled by the per-pixel noise level after masking. Each is mean-subtracted independently. The residuals are more (standard) Gaussian than the map, with a high-end tail noting the missing sources in the COSMOS2020 catalog. Bottom right: Flux in the map versus in the residuals at the pixel location of sources in the Herschel/SPIRE point source catalog. Also plotted is a linear fit, with each pixel location weighted by the SNR; this encapsulates a measure of how much LinSimStack under-resolves the HSPSC sources.
Current usage metrics show cumulative count of Article Views (full-text article views including HTML views, PDF and ePub downloads, according to the available data) and Abstracts Views on Vision4Press platform.
Data correspond to usage on the plateform after 2015. The current usage metrics is available 48-96 hours after online publication and is updated daily on week days.
Initial download of the metrics may take a while.