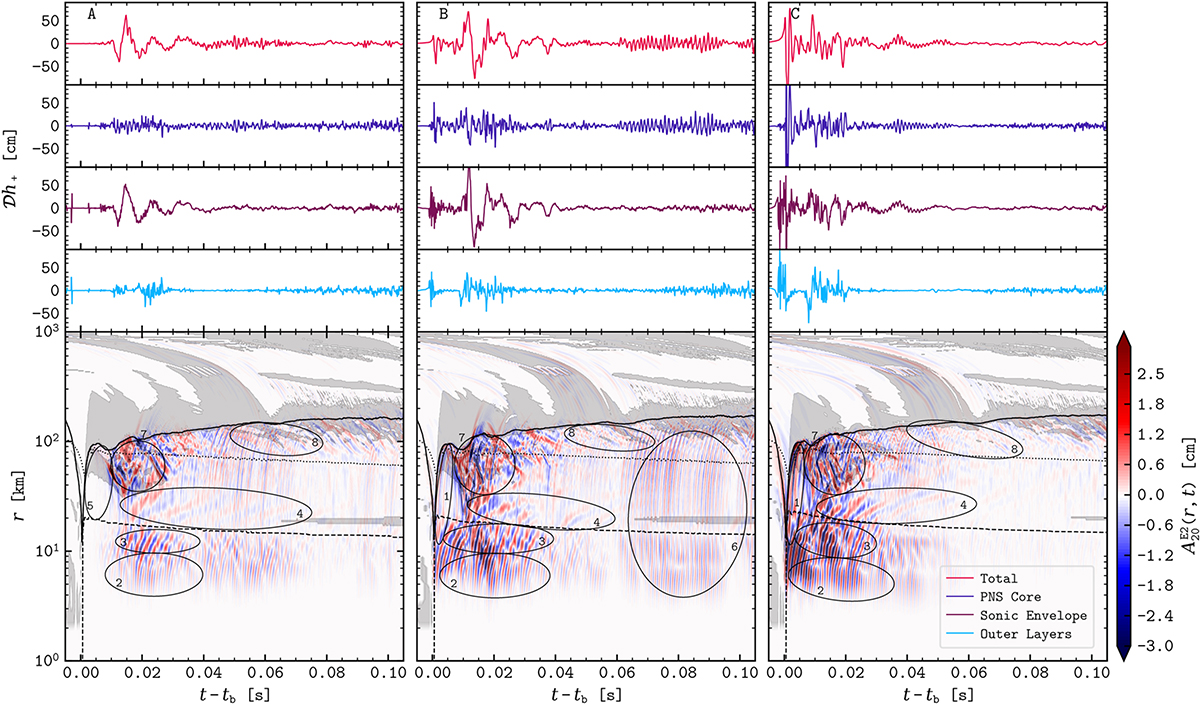
Fig. 1.
Download original image
Evolution of GW amplitude for models s0.0-1 (A), s1.0-1 (B), and s2.0-1 (C). Panels from top to bottom show the time evolution of the GW amplitude for the whole simulation domain, PNS core, sonic envelope, and outer layers. Finally, the bottom row shows the space-time evolution of 𝒟h(t, r). Dashed, solid, and dotted lines represent the PNS core, sonic envelope, and PNS average radius, respectively. Grey shades mark regions where N2 < 0, i.e. approximately, regions where convection takes place. Numbered ellipses identify GW modes in each region (see text).
Current usage metrics show cumulative count of Article Views (full-text article views including HTML views, PDF and ePub downloads, according to the available data) and Abstracts Views on Vision4Press platform.
Data correspond to usage on the plateform after 2015. The current usage metrics is available 48-96 hours after online publication and is updated daily on week days.
Initial download of the metrics may take a while.