Open Access
Fig. B.1.
Download original image
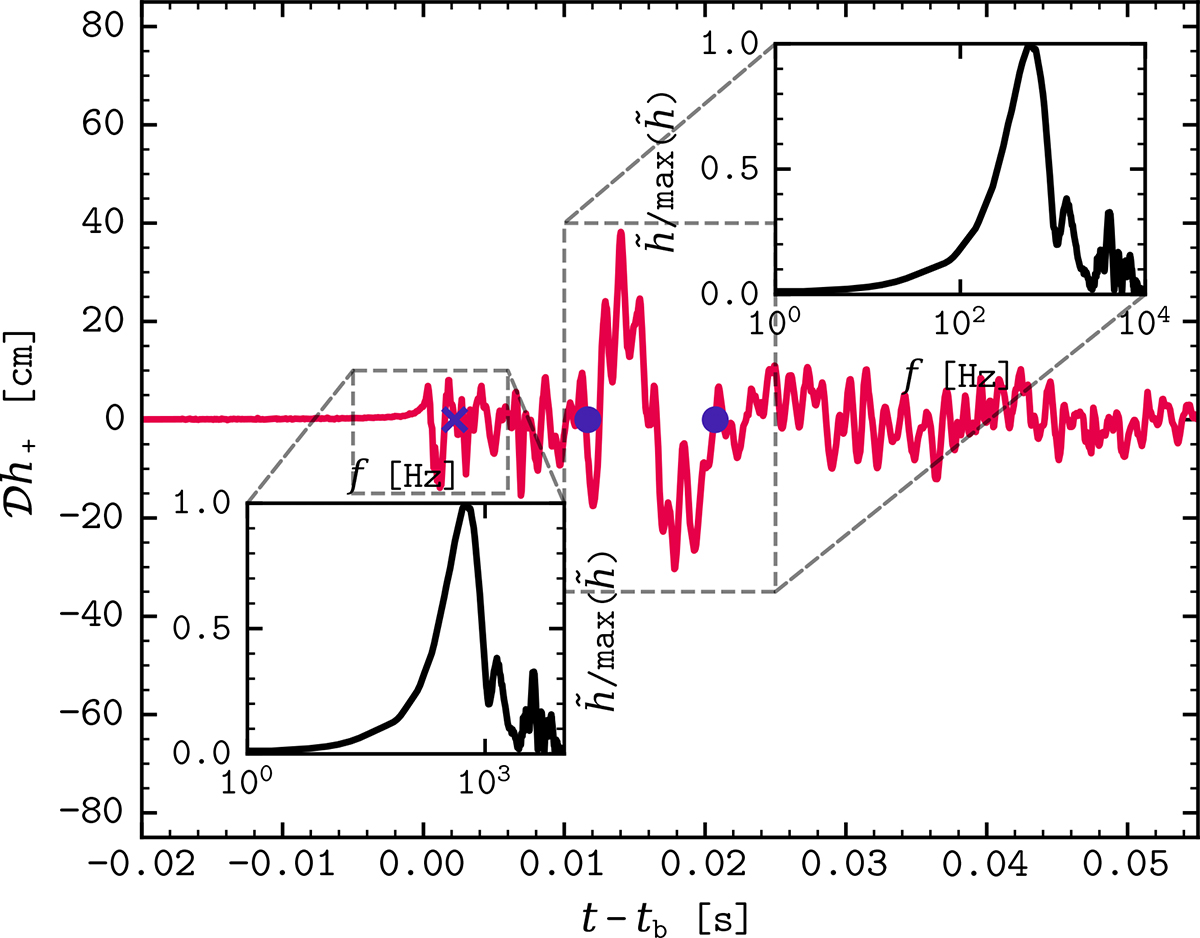
GW evolution during the first 55 ms for model s0.6-1. The blue cross marks the end of the bounce peak, and the blue circles locate the beginning and end of post-bounce oscillation. Insets show the normalised Fourier transform of the strain, ![]() .
.
Current usage metrics show cumulative count of Article Views (full-text article views including HTML views, PDF and ePub downloads, according to the available data) and Abstracts Views on Vision4Press platform.
Data correspond to usage on the plateform after 2015. The current usage metrics is available 48-96 hours after online publication and is updated daily on week days.
Initial download of the metrics may take a while.