Open Access
Fig. 2.
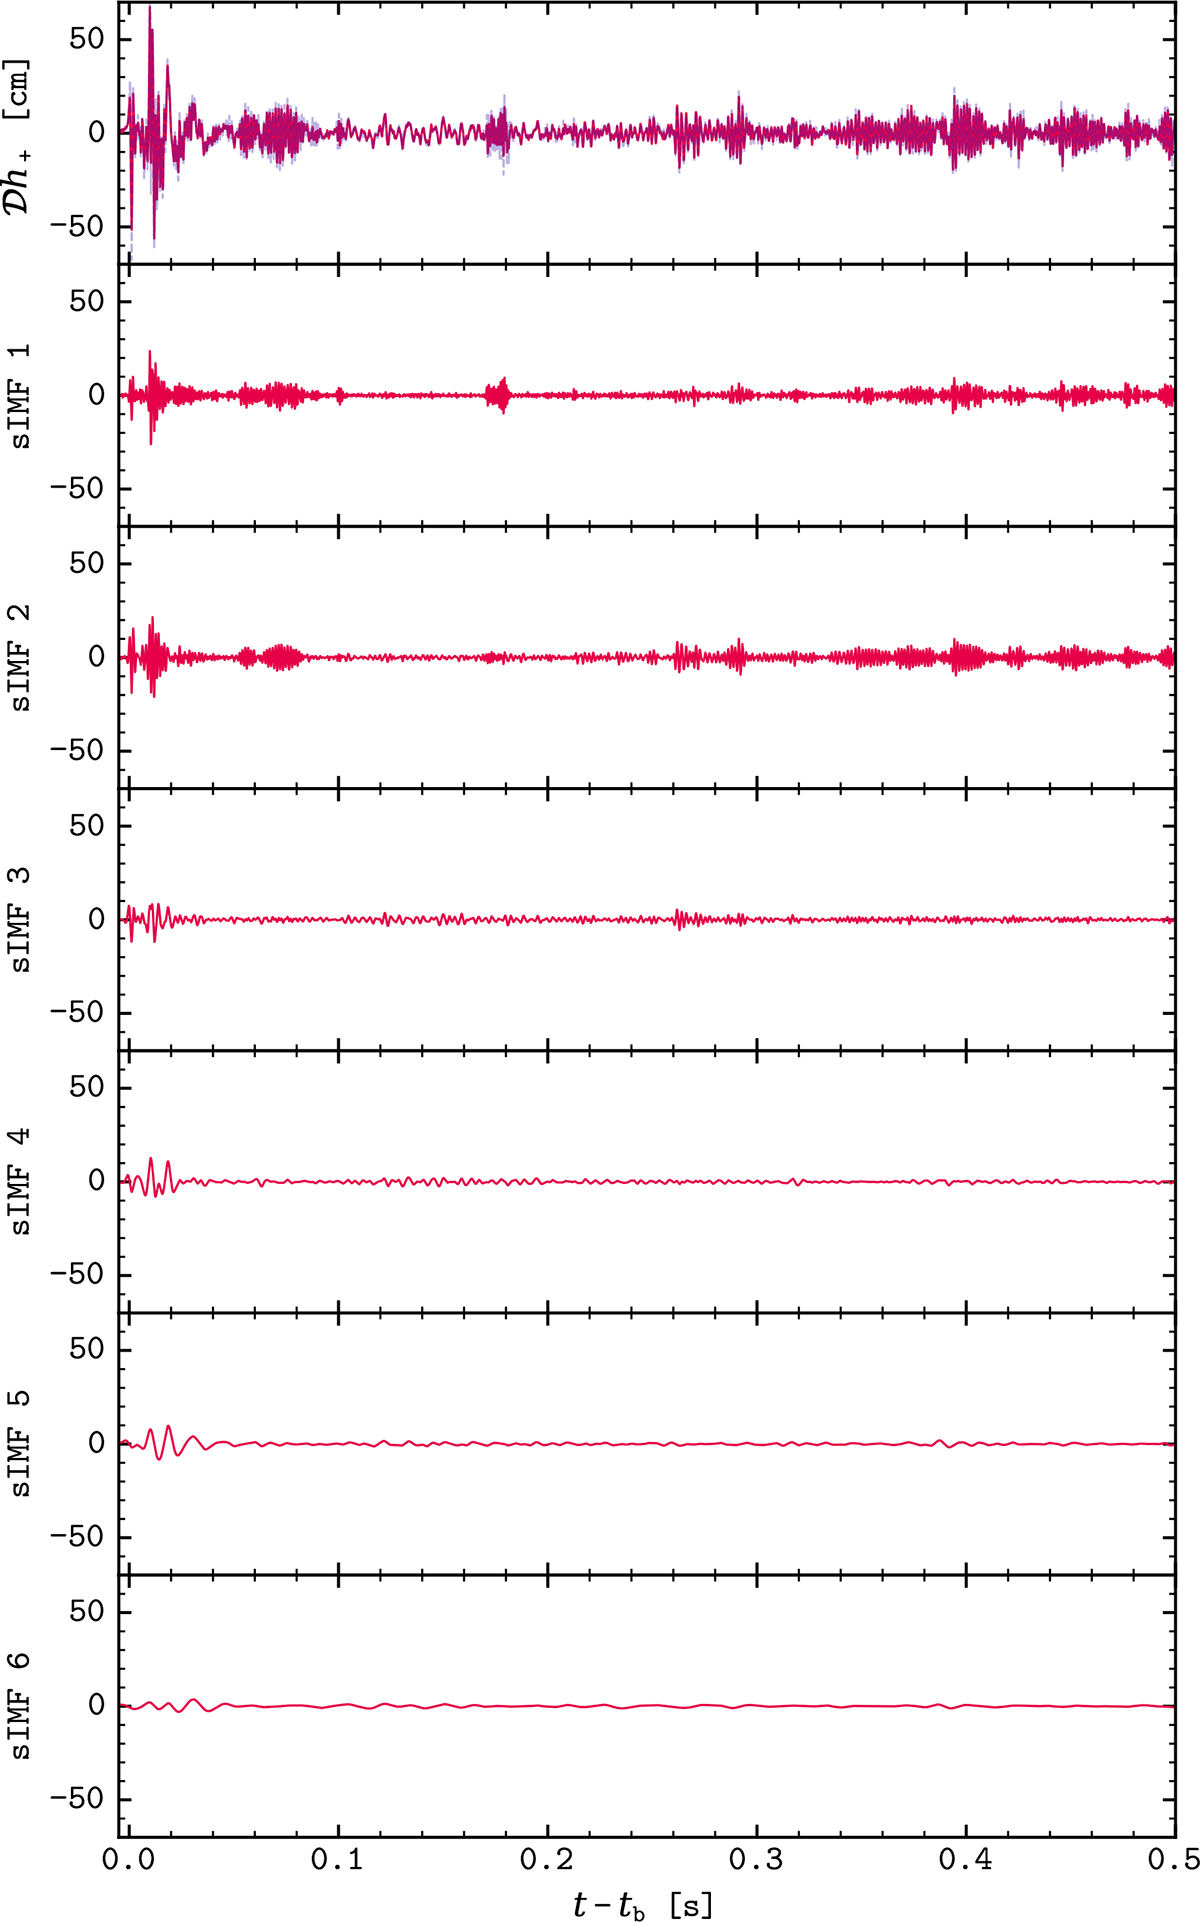
Download original image
Time evolution of the total GW strain and the six sIMFs for model s1.2-1. The dashed blue line on the first panel represents the full strain extracted on the whole simulation domain, and the solid red line the strain as a sum of the sIMFs.
Current usage metrics show cumulative count of Article Views (full-text article views including HTML views, PDF and ePub downloads, according to the available data) and Abstracts Views on Vision4Press platform.
Data correspond to usage on the plateform after 2015. The current usage metrics is available 48-96 hours after online publication and is updated daily on week days.
Initial download of the metrics may take a while.