Fig. 5.
Download original image
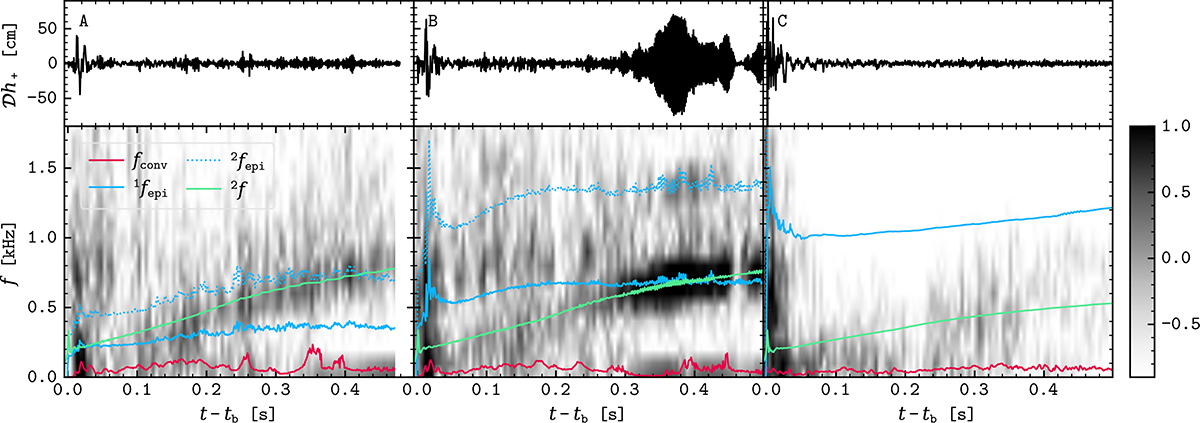
GW amplitude (top row) and corresponding spectrograms for models s0.4-1 (panel A, representative of the class of slowly rotating models), s0.9-1 (B, prototype of intermediately rotating cases) and s2.4-1 (C, representative of the class of fast-rotating models), calculated with a time window of 10 ms. The red line corresponds to the convection frequency (Equation (8)) at the sonic envelope surface, the blue lines show the epicyclic frequency (solid) and its first overtone (dotted) in the π/4 direction at the PNS core surface, while the green line is the fundamental quadrupolar mode frequency (2f) computed with the quasi-universal relation in Torres-Forné et al. (2019b).
Current usage metrics show cumulative count of Article Views (full-text article views including HTML views, PDF and ePub downloads, according to the available data) and Abstracts Views on Vision4Press platform.
Data correspond to usage on the plateform after 2015. The current usage metrics is available 48-96 hours after online publication and is updated daily on week days.
Initial download of the metrics may take a while.