Table C.1.
Detectability of the bounce signal for the full network of current generation detectors.
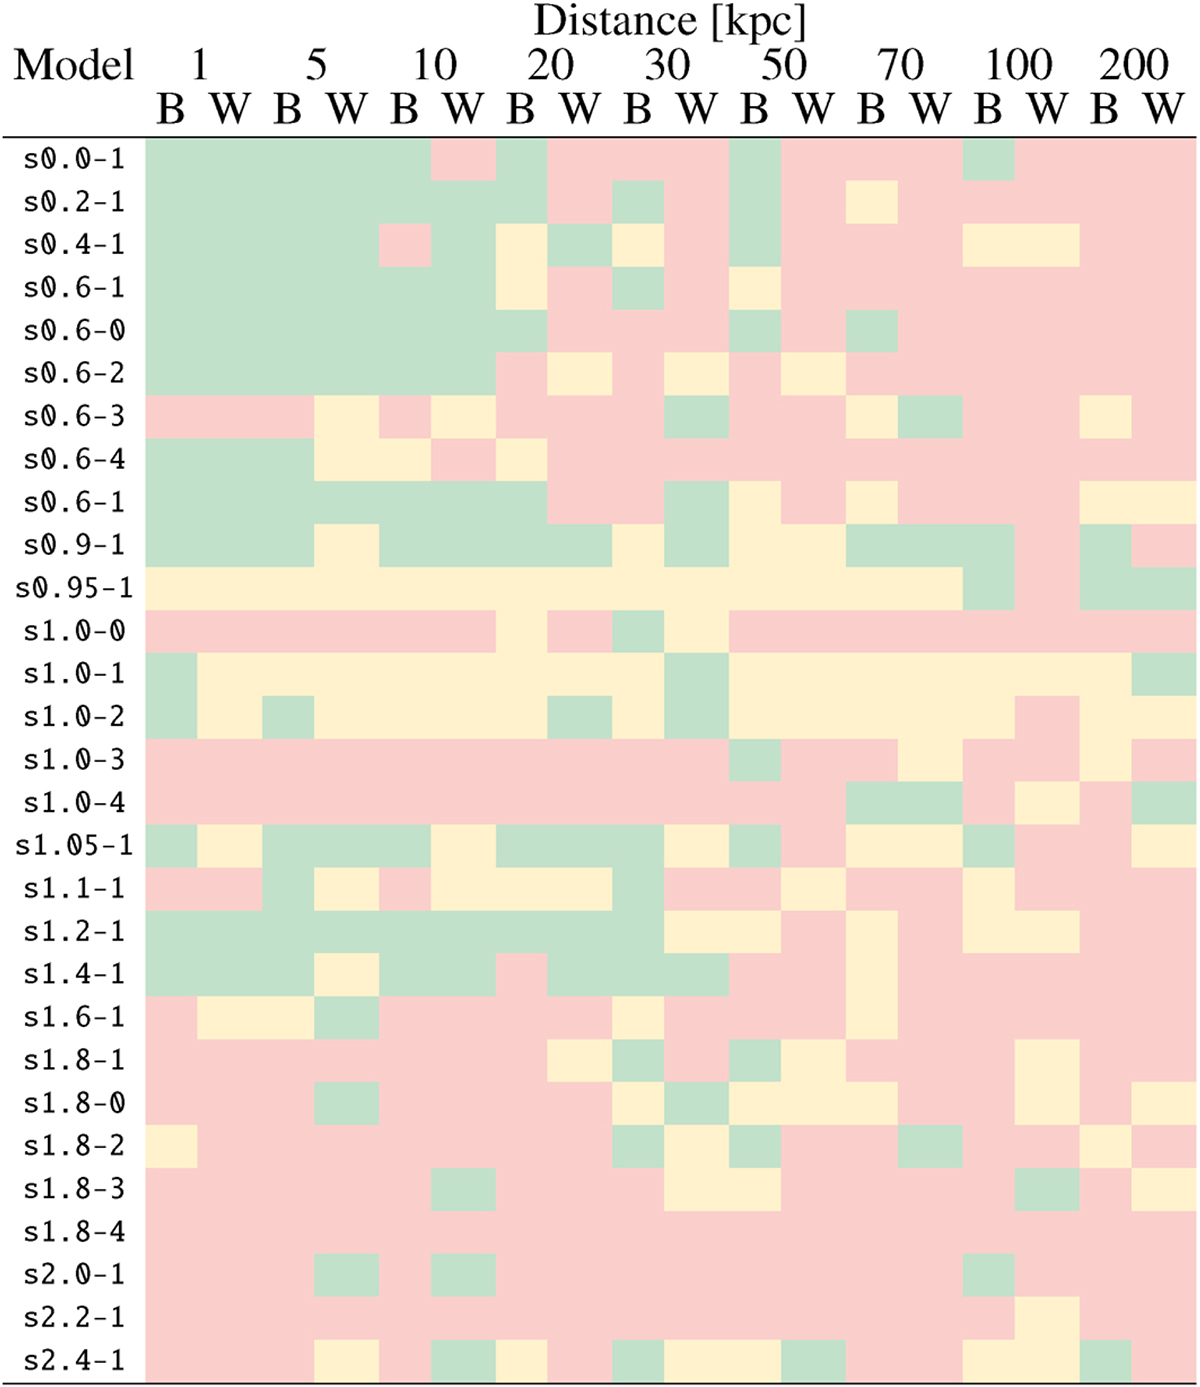
Notes. Columns from left to right: model name, then best and worst case scenario for a source located in the direction of the Milky Way’s bulk at varying distance, from 1 kpc to 200 kpc. Cells coloured in green represent simultaneous detection with at least two detectors, cells in yellow with one detector, and in red no detection.
Current usage metrics show cumulative count of Article Views (full-text article views including HTML views, PDF and ePub downloads, according to the available data) and Abstracts Views on Vision4Press platform.
Data correspond to usage on the plateform after 2015. The current usage metrics is available 48-96 hours after online publication and is updated daily on week days.
Initial download of the metrics may take a while.